2013-02-08-Preprocessing
Table of Contents
- 1 Preprocessing
- 2 Real World is Dirty
- 3 Causes of Problems
- 4 Preprocessing
- 5 Missing Values
- 6 Fill Missing Values
- 7 Normalization
- 8 Min-max
- 9 Z-score
- 10 Comparison
- 11 Removing Noise
- 12 Data integration
- 13 Other measures of "close"
- 14 Χ2 Correlation Test
- 15 Covariance & Correlation
- 16 Data Reduction
- 17 Subset Selection
- 18 Principal Component Analysis
- 19 Netflix and PCA
1 Preprocessing
2 Real World is Dirty
- Incomplete
- missing timestamps for actions
- Noisy
- salary = -10
- Inconsistent
- age: 42, birthday: 1997-03-07
2.1 Types of dirty notes
- Incomplete
- lacking some attribute values, containing only aggregate data. Eg. We often regret not including timestamps on different actions like UFCing, instead of tracking total votes (aggregation)
- Noisy
- Containing errors, like impossible salary data, or decimals in the wrong place
- Inconsistent
- If there's every two fields that depend on each other, in a large dataset you'll find them disagreeing. Errors ofen come from failures: processes failing halfway into updating
3 Causes of Problems
- Humans
- Software
- Hardware
3.1 Problems notes
- Berkeley experiment to measure temperature across campus
- Turned out average on campus much warmer than external weather services predicted
- But sample data looked in line with predictions
- Problem: one monitoring station right next to air conditioning unit!
- Hardware failure rare, but with large numbers of machines, probable. Eg. RAM can suffer ~1 bit/hour/gigabyte (ECC can help)
3.2 Inconsistent Different Sources
- Great value in combining data sources
- Challenge is merging them together, removing duplicates
- Example: Business names
3.3 Business names notes
- Starbucks vs. Starbucks Coffee Shop
- Buck's vs Bucks
- Trying to use address? Stackbucks vs. Starbucks across the street
- Best strategy here is to use DM/ML techniques on the combination of features to determine likelihood of match. We'll discuss specific algorithms later in the course
4 Preprocessing
- Cleaning
- fill missing values, smooth noisy data, identify or remove outliers, resolve inconsistencies
- Integration
- merging data from multiple sources
- Reduction
- obtain a smaller data set that can sufficiently answer important questions
- Transformation
- change data to a form that is easier to mine or analyze
4.1 Flu Trend Problems (Questions) notes
- We have millisecond search resolution, but will only be plotting on a per day basis
- We have the exact text of each query, but just care if it is about the flu or not
- Flu Trends, we sometimes see out of control search bots doing 100,000s of searches per day
- Mobile phone searches and web searches hit different machines, software, logs
- We have IPs in the logs, but will by plotting against geographical areas
5 Missing Values two_col
| Person | Height |
| Jim | 6'0 |
| Ashley | - |
| Sam | 5'11 |
| Alice | 5'9 |
| Kate | - |

5.1 What to do? notes
- (Heights are made up)
- We want to get an average class height
- Q: What to do with missing rows?
- ignore, fill, constant, average, average wrt gender
6 Fill Missing Values animate
- Ignore the record
- Find value manually
- Global constant
- Average
- Average with respect to class
- "Most probable"
6.1 Details notes
- Trade-offs
- core to engineering
- Ignore
- simply drop from data set. Hope there are not too many to affect answer. Drawbacks? When missing values are all same class (skew data)
- Find value manually
- Even for a small class, might be difficult. Get ruler, measure them. For historical data, impossible.
- Global constant
- replace with "N/A" or "6 foot". Can skew data, or cause data to pop in other analysis (all grouped together)
- Average
- Mean or median. Either one has potential problems.
- Average with respect to class
- gender. Average female/male height to fill in values
- "Most probable"
- Think of as another step from avg -> class avg. Now throw in other details: age, family history, shoe size. Then weight depending on how much those factors are correlated. Pretty soon you have a regression or Bayesian model, which will cover later
7 Normalization
- Type of data transformation to make reasoning and comparison easier
- Is 6' tall?
- Coefficients on attributes in regressions understandable
7.1 Context, Comparison notes
- 6' Might be tall for this class, but not on a basketball team
- How to know when a data point "average" or towards the top of a range?
- For our housing model, we wanted to use sq. footage and # of bedrooms. But the sq. footage number is huge compared to bedrooms. If we didn't normalize, a formula for determine house price might seem to indicate that # of bedrooms was way more important
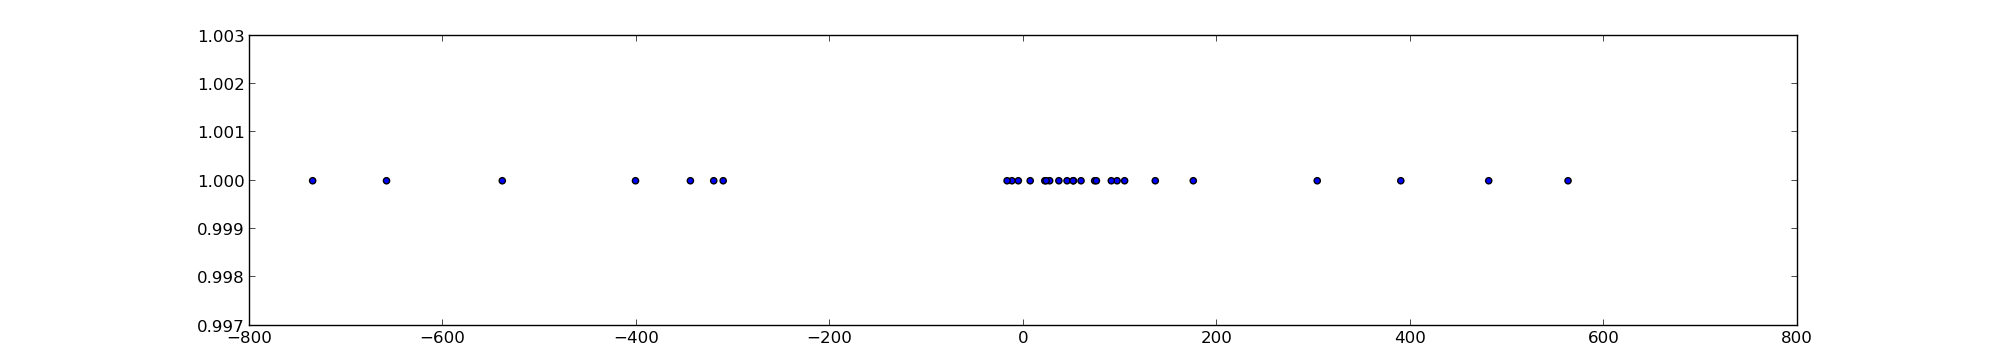
8 Min-max

8.1 New Range notes
- Typically new range is
- [0-1] (thought of as %)
- [-1-1] (though of as bad->good
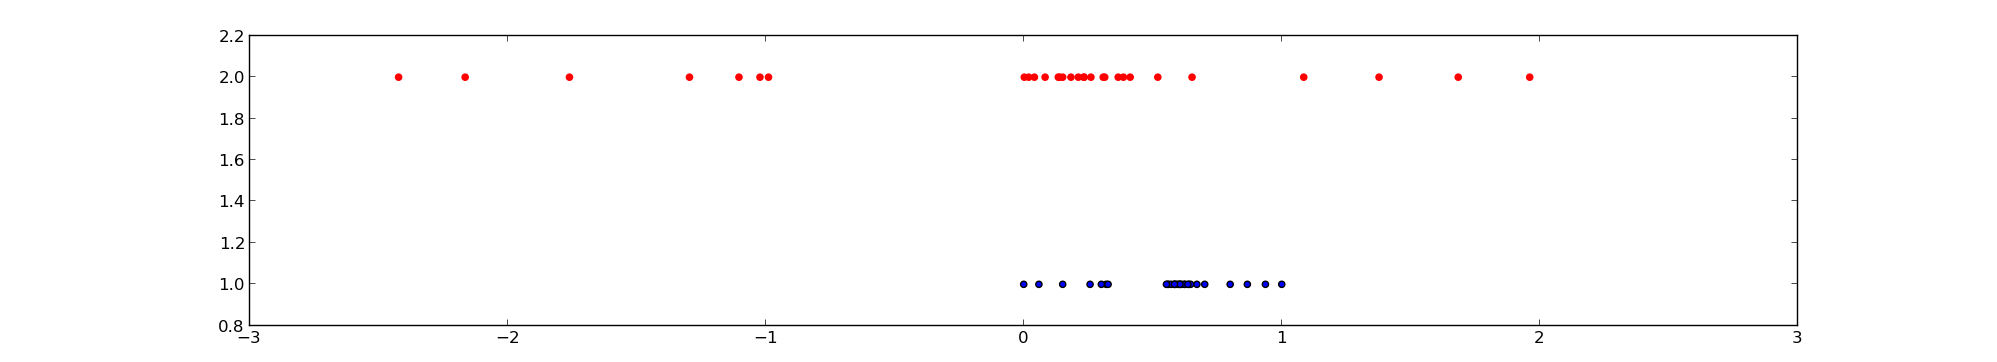
9 Z-score
9.1 Uses notes
- When you want a relative measure of deviation
- When you have a distribution estimate, but are unsure of absolute min-max
10 Comparison
10.1 Min-max vs Z-score notes
- Min-max: Known range
- Z-score: more expressive range
- Min-max: requires knowing min-max
- Z-score: can estimate with sampling or informed guess
11 Removing Noise
- Binning
- create B bins << N data samples, use aggregate statistic of bin for value
- Regression
- fit data to a function, use function value
- Outlier analysis
- find outlying points, understand and/or ignore them
11.1 Monitoring Problem notes
- For the problem encountered in temperature monitoring, which makes the most sense?
11.2 Trade-offs
- Binning
- Simple way to remove outliers, but difficult to pick buckets correctly
- Regression
- If one metric is a direct function of another, what extra information does the value provide?
- Outlier analysis
- Manual process of understanding outliers, ignoring them can obscure some analysis (eg. income disparity)
11.2.1 Trade-offs again notes
- Remember: this class is exposing you to potential tools, up to you to be asking the right questions, selecting the appropriate algorithms, interpreting results
12 Data integration
- Merging two data sources
- Problem: uniquely identify a concept in both sources
- Find data points that are very "close" to each other, call them the same with some probability
- Example: Yelp Menu Data
12.1 Yelp Menu Data notes
- Recently launched menu data
- Takes data about the restaurant menu, find reviews & pictures referring to the menu item
- Joins them together
- Many different metrics for "close": remember them?
13 Other measures of "close"
Are A and B close?
| A | B |
| 2 | 60 |
| 5 | 150 |
| 6 | 180 |
| 10 | 300 |
| 13 | 390 |
13.1 Correlation notes
- Imagine
AandBhave several different dimensions, maybe things like length, height, width, radius - Are they similar?
- On one hand no: clearly different order of magnitude
- Another way to think about similarity is correlation
- All of
Bdimensions are 30x ofA - Maybe just using different units!
- If I plotted
AandBand x,y, what would the result look like?
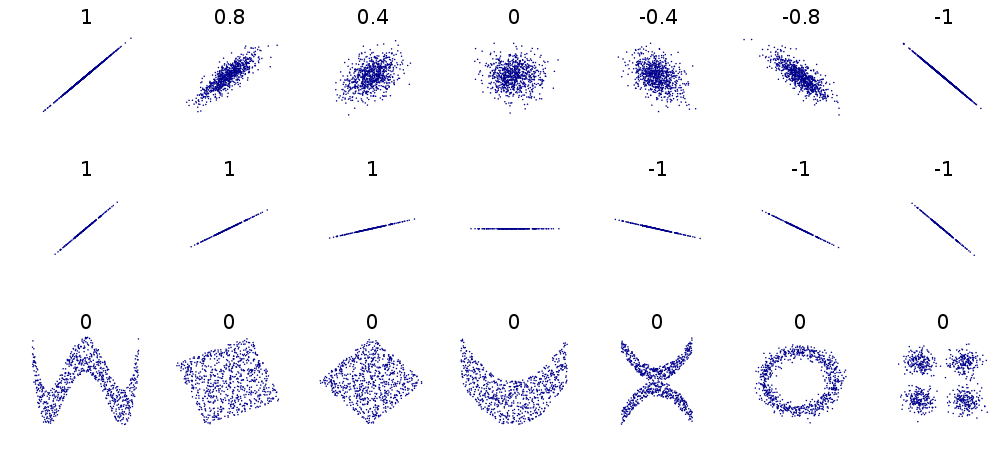
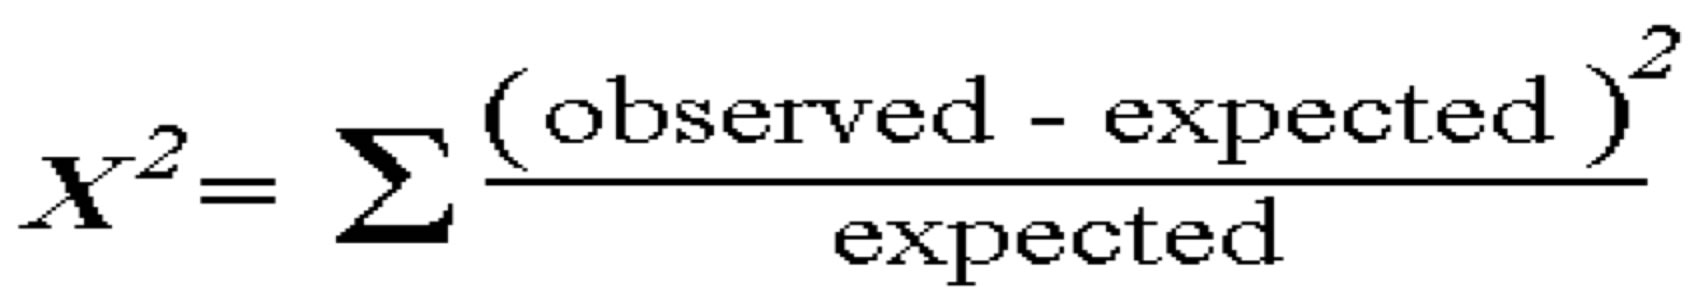
14 Χ2 Correlation Test
14.1 Motivation notes
- Answer: a straight line
- So a correlation coefficient gives a sense of how closely linearly related two data sets are
- Note, besides positive & negative, the slop does not affect the correlation score, just how well fit the data is
- Also note I said linear: patterns may still be exhibited, but they are not linearly related, eg 30x
- Details of test are in book, you are expected to understand it
- Motivation: how different are the observed values from the expected?
- Expected is calculated using probability with the assumptions that the sets are independent
15 Covariance & Correlation
- Correlation is "normalized" covariance
- Covariance describes the degree to which two data sets track each other in units of of the two data sets
- Correlations describes the degree of similarity without units
15.1 Use in industry notes
- Χ2 used most commonly, handy to have an expected [0-1] range
- "Correlation does not imply causation"
- A->B, B->A, C->A,B, A->B->A…, coincidence
16 Data Reduction two_col
- Dimensionality
- remove attributes that are the same or similar to other attributes
- Numerosity
- represent or aggregate the data, sometimes with precision loss
- Compression
- generalized techniques to decrease the number of bytes needed to store data
16.1 Deep Dive notes
- We're only going to cover selected topics in these areas.
- When reading, make sure to understand the intuition behind the other techniques, but if we don't cover it in lecture, you won't need to calculate it in midterm
- Ask questions about the concepts you don't understand! That's what separates this class from a book :)
- But still potentially useful for your projects!
- img: http://www.flickr.com/photos/marcovdz/4520986339/sizes/o/in/photostream/
17 Subset Selection
- Two many attributes?
- Ignore some
- Tricky part: which to ignore?
- height x width = area
17.1 Simple to Sophisticated notes
- Ignore the ones that are not helpful
- Ignore an attribute highly correlated with another (cm, in)
- Ignore an attribute that can be built from others
18 Principal Component Analysis
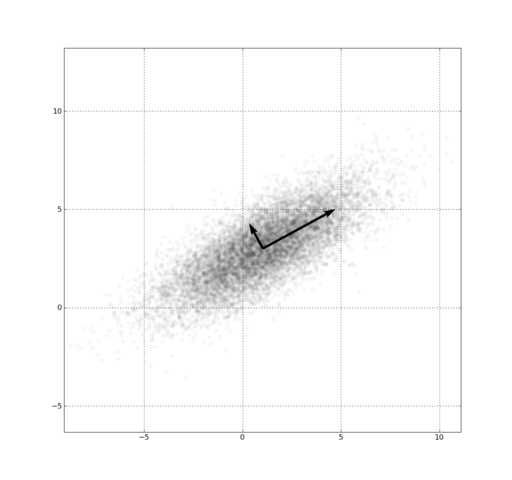
- Map data to a locatoin along a few vectors
18.1 Higher dimensions notes
- Remember, 2 dimensions might not make much sense, but becomes useful in higher number of dimensions
- These points described by two attributes, <x,y>
- What if we wanted to describe them in just 1 dimension?
- Pick some good vectors (in our case 1)
- Describe where a point is located using only those vectors
19 Netflix and PCA
- A user may have many preferences: Mission Impossible, Love Actually, Man from Nowhere, …
- Instead of keeping track of every preference, we can summarize
- Action, RomCom, Foreign
19.1 Summarize in discovered dimensions notes
- With 3 or more "categories", we can reconstruct the user's likely preferences
- Dimensions don't necessarily fit into human notions: probably is not an "foreign" dimension, but a subtle combination of other aspects