2013-02-22-Decision-Trees
Table of Contents
- 1 Classification: Decision Trees
- 2 Types of Models
- 3 Process
- 4 Learning
- 5 Classification
- 6 Machine Learning
- 7 Confusion Matrix
- 8 Recall & Precision
- 9 Example: Search
- 10 Decision Trees
- 11 Build a Tree
- 12 Build a Tree
- 13 Decision Tree Induction
- 14 Information Gain
- 15 Gini Index
- 16 Splitting
- 17 Decision Tree Advantages
- 18 Break
1 Classification: Decision Trees
2 Types of Models animate
- Classifiers
- Regressions
- Clustering
- Outlier
2.1 Details notes
- Classifiers
- describes and distinguishes cases. Yelp may want to find a category for a business based on the reviews and business description
- Regressions
- Predict a continuous value. Eg. predict a home's selling price given sq footage, # of bedrooms
- Clustering
- find "natural" groups of data without labels
- Outlier
- find anomalous transactions, eg. finding fraud for credit cards
3 Process animate
- Training Set
- Learning
- Model / Classifier
- Testing Set
- Verification / Accuracy
- New Data
- Classification
3.1 Steps notes
- Process
- to be able to classify data
- Training Set
- Cleaned, preprocessed data that has labels. What are labels?
- Learning
- Feed the training set to an algorithm. Algorithm associates some of the features with the labels and generates a model.
- Model / Classifier
- Process or formula used to predict the label (class) given inputs (data record)
- Testing Set
- Data not in training set, with labels. Run through model to see how the model compares with the real labels.
- Verification / Accuracy
- Given the matches / mismatches in the testing set, how can we measure how well the model reflects reality?
- Unseen Data
- Finally, we're ready to start using our model / classifier to label new, real, unknown data! So clean and pre-process it the same way.
- Classification
- Feed the unknown data and get out results!
4 Learning
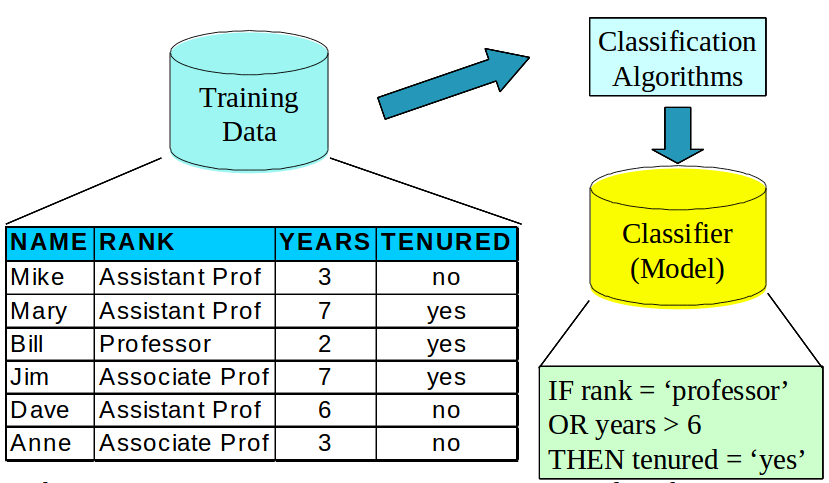
4.1 Example notes
- We have training data. What are these column types?
- Feed it into a classification algorithm
- In the case it is generating Rules.
- Models can be as simple as this: just a set of rules to follow. We'll see how we can extend this idea
- The learning step generates a model: these rules
5 Classification
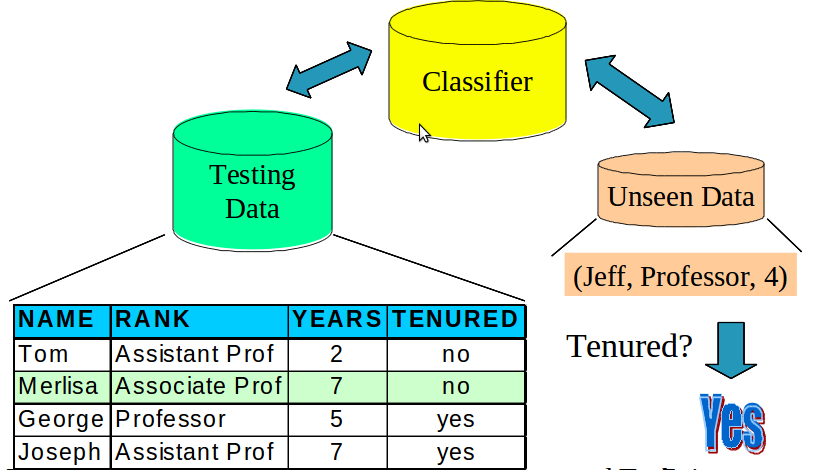
5.1 Possibilities notes
- Now that we have the model / classifier, we can do two things
- 1: Use testing data different from training data
- compare the classifier guesses with reality
- 2: Use the classifier on unknown data
- Why not just jump into classifying unknown data? Why have a test step?
6 Machine Learning
- Supervised
- Given data with a label, predict data without a label
- Unsupervised
- Given data without labels, group "similar" items together
- Semi-supervised
- Mix of the above: eg. unsupervised to find groups, supervised to label and distinguish borderline cases
- Active
- Starting with unlabeled data, select the most helpful cases for a human to label
6.1 Which is this? notes
- In the example above, what type of learning?
- Supervised: we have labels, we want to guess unlabeled data
7 Confusion Matrix
- What are the ways that classification can be wrong?
| Predict: Positive | Predict: Negative | |
| Actual: Positive | True Positive | False Negative |
| Actual: Negative | False Negative | True Negative |
7.1 Basis for Evaluation notes
- Most methods of evaluating results start with the confusion matrix
- Figuring out what different ways you were right or wrong
- Then using different formulas to emphasize the things you care about
8 Recall & Precision
- Recall:
TP / P - Precision:
TP / (TP + FP) - Sometimes these are in tension; other measurements balance them
8.1 Trade-off notes
- Classic trade-off in search
9 Example: Search
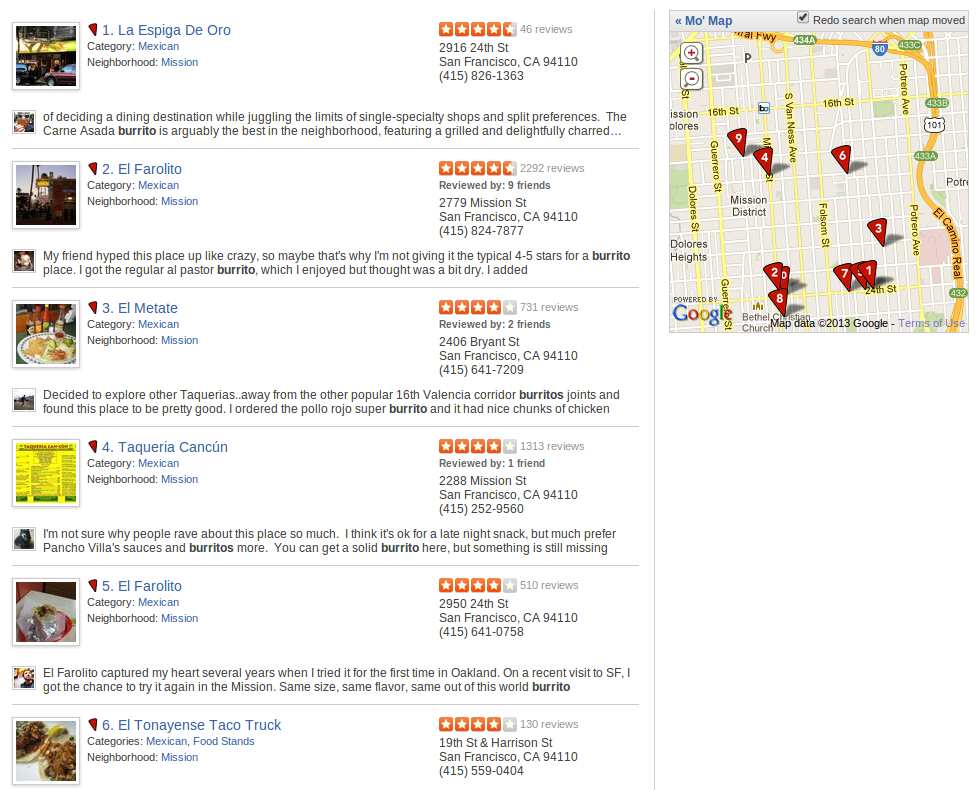
9.1 Searching Yelp notes
- Searched yelp for a burrito in the Mission
- How good are these search results?
- Let's say we knew this first result was great, and only returned it
- What would our precision be?
- What would the recall be?
- How could we improve recall?
- How can we guarantee 100% recall?
- What will that do to the precision?
- Understand ways of combining these measurements in the book
10 Decision Trees
- Rules formulated as a tree of decisions
- Choose Your Own Adventure for machine learning
- So how do we build the trees?
10.1 Rules expressed trees notes
- At each node in the tree, pose a question
- Take a branch depending on your answer
- Leaf nodes are labels
11 Build a Tree
11.1 Directions notes
- First node question: is rank=professor?
- If True, what's the label?
- If False, we go to another node
- Second node question: is years > 6?
- If True what's the label?
- If False, what's the label?
12 Build a Tree
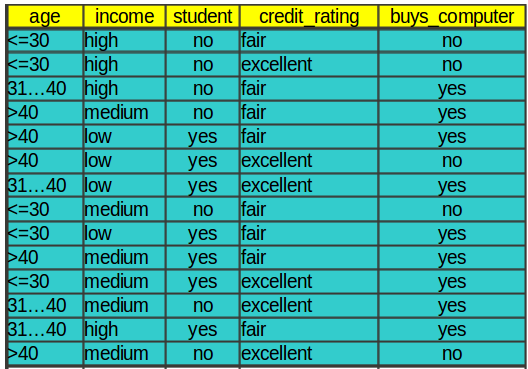
12.1 Next challenge notes
- How to go from a data set like this
12.2 Build a Tree
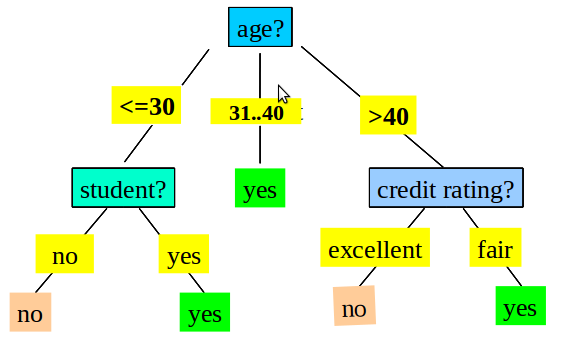
12.2.1 Result notes
- To a tree like this?
13 Decision Tree Induction
- Start with all the data
- Choose the "best" way to divide it up based on one attribute
- Make a node that asks a question to split the data
- Choose new "best" way to divide based on remaining attributes
- Stop: no attributes left, all records are the same class
13.1 Recursive notes
- Look at all the attributes. What's the best way to split up the data?
- We'll look at way to mathematically evaluate splits
- Now recursively do the same
- If you've split on all the attributes, but still have a mix, use a majority rule
- If all the records are the same class, you don't have to keep spitting: your answer is right there!
- For continuous data, must bucket it so you can have a discrete number of answers
14 Information Gain
- Comparison of how mixed results are before and after splitting
- Entropy measurement of "mixed"
- Two pure data sets have less entropy on average than one mixed
14.1 Information notes
- Book will go into detail about how to think about entropy
- General idea: how difficult would it be to memorize the data sets?
- Easy if pure: all class A
- Still fairly easy if 2 pure sets: 1 is class A, other is class B
- Now more difficult if they are mixed: first 2 records are A, then one B, then another A
15 Gini Index
Gini(D) = 1 - sum(frac**2 for frac in classes)
Sum of the squares of the fraction of items in each class
16 Splitting
- Discrete values can split per value
- Or discrete values binary split into subsets
- Continuous values can split on range (usually 2)
16.1 Different notes
- If you'd like a binary tree (useful for some algorithms), can split on subsets
- Can't split 400 different ways on continuous values… what about values that haven't been seen before?
17 Decision Tree Advantages
- Models easy to understand and visualize
- Can be faster to construct
- Can encode tree in declarative languages (SQL)
- Robust: outliers generally fit in with normal data
17.1 Trees notes
- Its a tree! Easy to draw
- Greedy algorithm means you're only go over the data so many times
- Models can translate into database statements
- Outliers don't have a numeric pull on the data (similar to difference between median and mean)