2013-03-07-Clustering
Table of Contents
1 Clustering
2 Types of Models animate
- Classifiers
- Regressions
- Clustering
- Outlier
2.1 Details notes
- Classifiers
- describes and distinguishes cases. Yelp may want to find a category for a business based on the reviews and business description
- Regressions
- Predict a continuous value. Eg. predict a home's selling price given sq footage, # of bedrooms
- Clustering
- find "natural" groups of data without labels
- Outlier
- find anomalous transactions, eg. finding fraud for credit cards
3 Clustering
- Group together similar items
- Separate dissimilar items
- Automatically discover groups without providing labels
3.1 Perspectives notes
- Similar items: again, metrics of similarity critical in defining these groups
- Marking boundaries between different classes
- Type of groups unknown before hand. Out of many attributes, what tend to be shared?
4 Machine Learning
- Supervised
- Unsupervised
- Semi-supervised
- Active
4.1 Definitions notes
- Supervised
- Given data with a label, predict data without a label
- Unsupervised
- Given data without labels, group "similar" items together
- Semi-supervised
- Mix of the above: eg. unsupervised to find groups, supervised to label and distinguish borderline cases
- Active
- Starting with unlabeled data, select the most helpful cases for a human to label
5 Clustering Applications
- Gain insight into how data is distributed
- Preprocessing step to bootstrap labeling
- Discover outliers
5.1 Apps notes
- Closest we have to "magic box": put structured data in, see what groups may exist
- You want labeled data, but where to start? How many classes? What to name
them?
- Cluster data, investigate examples.
- Hand label exemplary cases
- Choose names that distinguish groups
- Run classifier on labeled data, compare with clustering, examine errors, repeat
6 Yelp Examples
- User groups based on usage, reviewing habits, feature adoption
- Businesses: when should a new category be created, what should it be called?
- Reviews: for a particular business, are there common themes. Show better variety?
6.1 Examples notes
- User groups may be trend spotters, "lurkers", travelers, early adopters
- Do we need a New American and American category? How similar are these categories?
- Does a reviewer need to read 10 reviews about great food, so-so service? Maybe providing different view points helps give a better picture
7 Intuition
- Intuition => Mathematical Expression => Solution => Evaluation
- High intra-class similarity
- Low inter-class similarity
- Interpretable
7.1 Good Clusters notes
- Just like all data mining, needs to be used to take action
- Can't take action if you don't understand the results
- Trade-offs: testing shows it works, but you don't understand it
8 Methods
- Partitioning
- Construct
kgroups, evaluate fitness, improve groups - Hierarchical
- Agglomerate items into groups, creating "bottom-up" clusters; or divide set into ever smaller groups, creating "top-down" clusters
- Density
- Find groups by examining continuous density within a potential group
- Grid
- Chunk space into units, cluster units instead of individual records
8.1 Algorithms notes
- Partitioning
- Method similar to gradient descent: find some grouping, evaluate it, improve it somehow, repeat. k-means.
- Hierarchical
- Build groups 1 "join" at a time, examining distance between two things that can be joined together, if close, combine groups. Reverse: divisive.
- Density
- Many of the above methods just look for distance. This method tries to find groups that might be strung out, but maintain a density. Think about an asteroid belt. It is one group, but not clustered together in a way you typically think.
- Grid
- Can speed up clustering and provide similar results
9 k-means
- Start: Randomly pick
kcenters for clusters - Repeat:
- Assign all other points to their closest cluster
- Recalculate the center of the cluster
9.1 Iterative notes
- Start at a random point, find step in right direction, take step, re-evaluate
10 Example
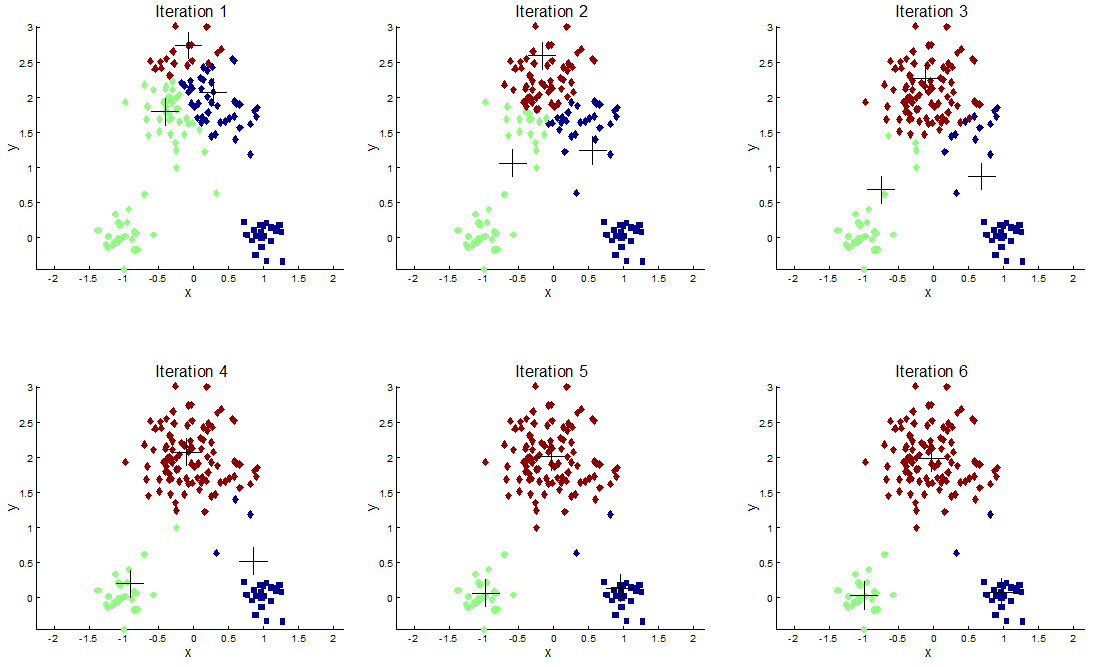
10.1 Process notes
- We pick some nodes at random, mark with a cross
- Find other points that are closest to the crosses
- Find new centroid based on the average of all points
- Start again
- img: http://apandre.wordpress.com/visible-data/cluster-analysis/
11 Distance
- Centroid is the average of all points in a cluster; the center
- Different distance metrics for real numbers
- But how to find "average" of binary or normative data?
11.1 You Can't notes
- k-means is used for numerical data
12 Normalization
- Cluster cities by average temperature and population attributes
- <x,y> = <temp, pop>
- Using Euclidean distance, which attribute will affect similarity more?
12.1 Un-normalized notes
- Population: it is a much bigger number, will contribute much more to distance
- Artificially inflating importance just because units are different
13 Normalization Techniques
- Z-score
(v - mean) / stddev- Min-max
(v - min) / (max - min)- Decimal
* 10/ 10- Square
x**2- Log
log(x)
13.1 Useful for? notes
- Z-score
- 1-pass normalization, retaining information about stdev
- Min-max
- keep within expected range, usually [0-1]
- Decimal
- easy to apply
- Square
- keep inputs positive
- Log
- de-emphasize differences between large numbers
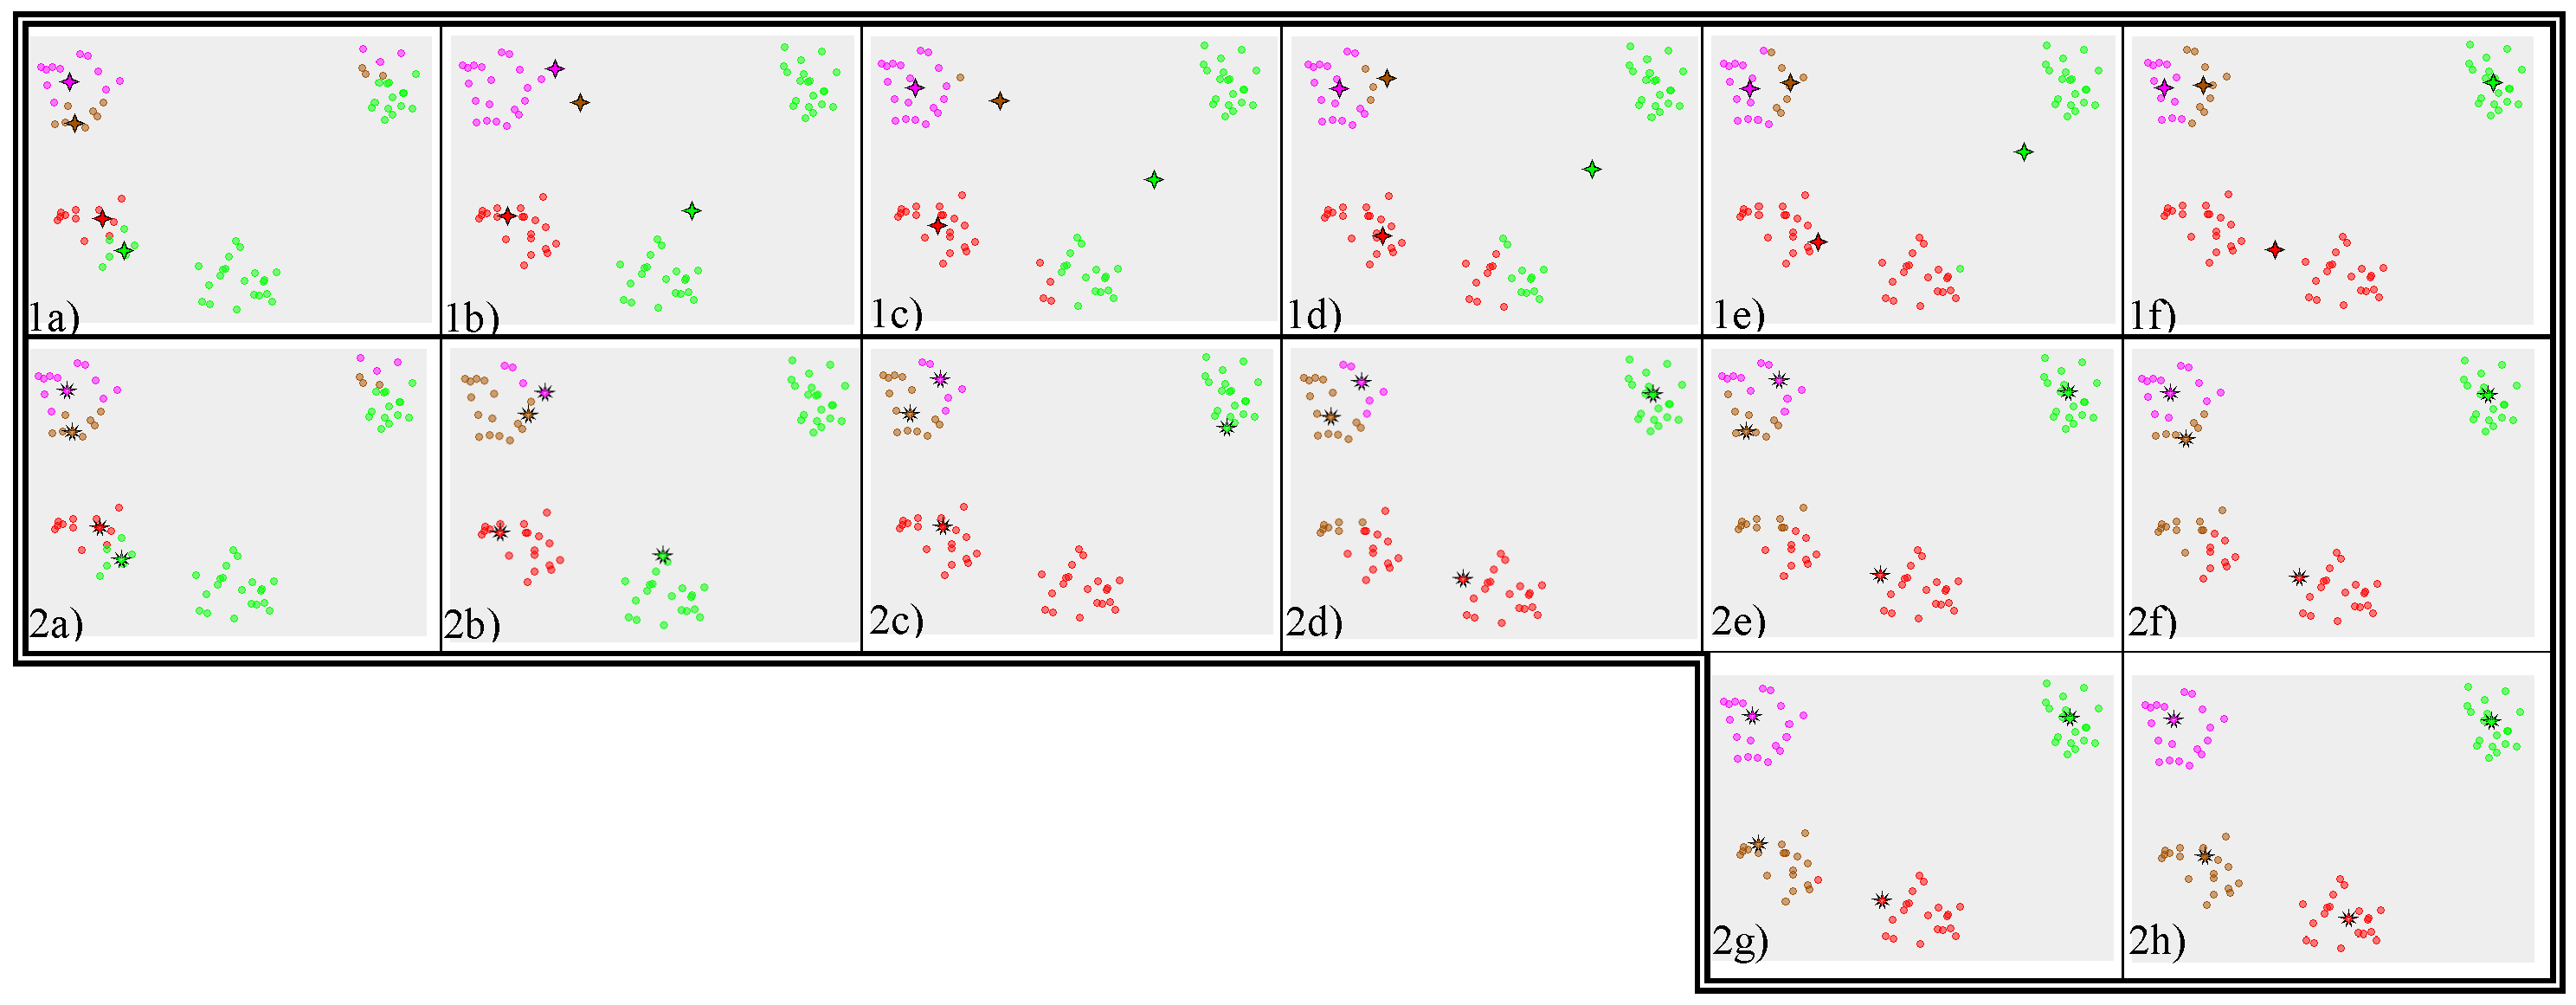
14 Local Optima
14.1 No Guarantee notes
- Since there are many possible stable centers, we may not end up at the best one
- How can we improve our odds of finding a good separation?
- Why did we end up here? starting points
- Choose different starting points
- Compare results
- Other problems? Mouse
15 Uneven Groups
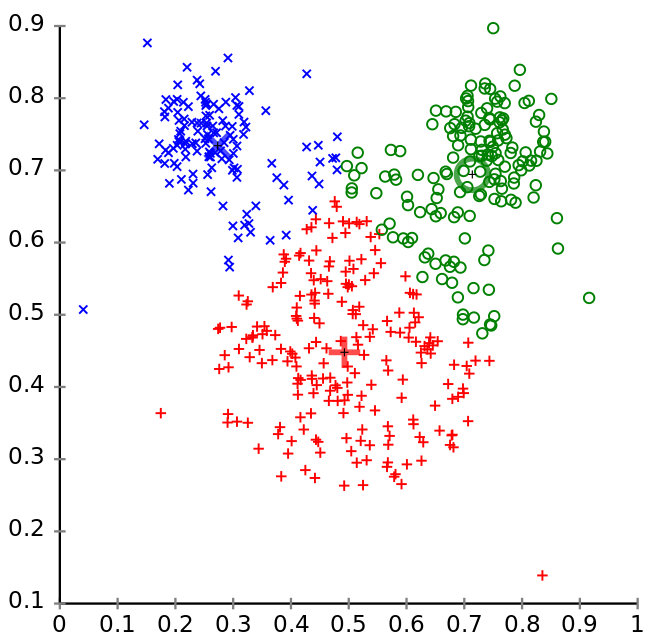
15.1 k-means notes
- k-means is good for similarly sized groups, or at least groups that are similar distance between other members
- Other problems that would pull the centroid away from the real groups?
- Outliers
- img: http://en.wikipedia.org/wiki/K-means_clustering
16 Medoids
- Instead of finding a centroid find a medoid
- Medoid: actual data point that represents median of the cluster
- PAM: Partitioning Around Medoids
16.1 Trade-offs notes
- PAM more expensive to evaluate
- Scales poorly, since we need to evaluate many more medoids with many more points
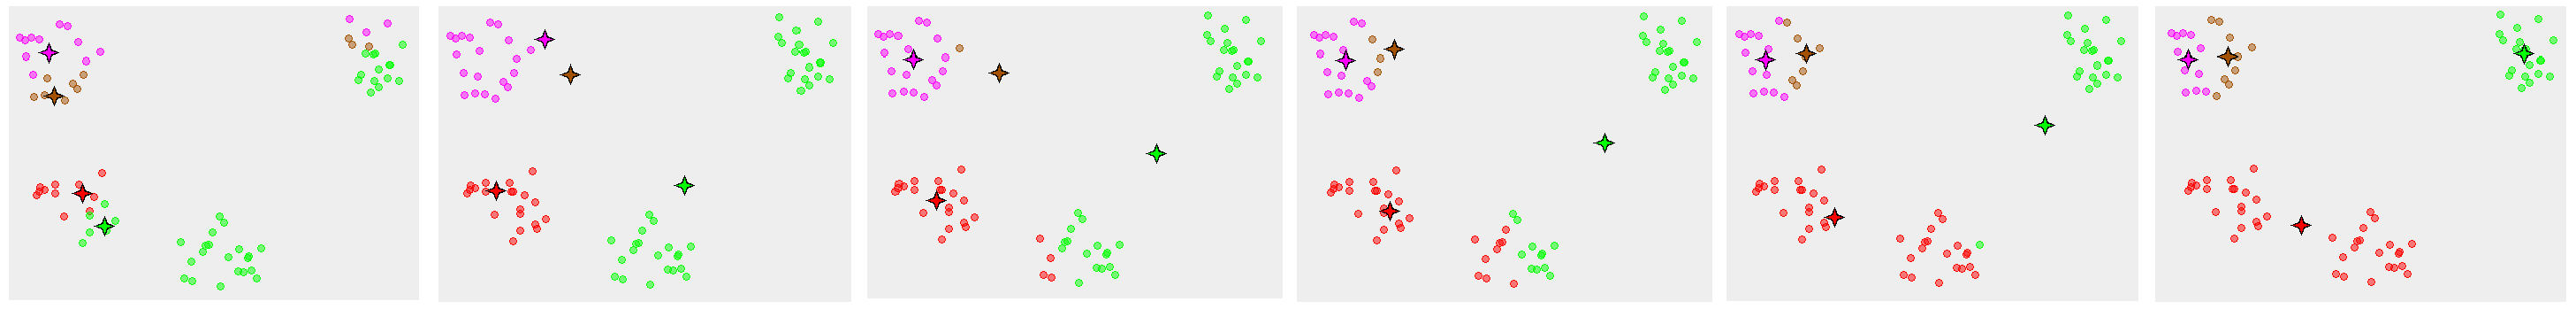
17 Example
17.1 Stability notes
- No stability between real clusters
- Outliers can't pull centroid far out of actual cluster
- img: http://en.wikipedia.org/wiki/K-medoids
18 Break
- Do not confuse Medoid with Metroid