2013-04-26-Multimedia
Table of Contents
1 Multimedia Data Mining
2 Features two_col
- Core algorithms similar to "traditional" data mining
- Difference lies in feature engineering
- How to translate intuitions to numbers and formulas?
3 Types
- Spatial
- geographic points and features, including natural and man-made phenomenon
- Images
- Size, color, shape, curves, relative positions
- Music
- Tone, tempo, beat, rhythm
- Voice
- Speed, accent, word pauses, background noise
3.1 Covering notes
- We'll cover these areas briefly to get an overview of techniques used in these fields
- All of these things have embedded information in them, and we are trying to extract it
- One of the reasons data mining is not a black box: some one has to be on the outside interpreting results. Results inform technique
4 Generalization two_col
- Many of these areas have digital representations
- Can we use the raw bit representations?
- Usually not: must generalize patterns

4.1 Density notes
- The data we get from digital representations is generally too sparse
- Key component of good learning is data, but you need fairly dense data to learn a pattern
- Hypothetically, a neural network could extract general features from raw data, but you'd need a really large amount of data in order to get the density needed
- Example: for NLP, perhaps your corpus is too sparse: not many words are shared between documents. So instead generalize: what parts of speech or patterns show up across documents?
5 Generalized Features
- Derivative / Slope of behavior
- Min / Max of groups of points
- Bucketing / Blurring
- Relative positions / angles
5.1 Techniques notes
- How can you strip some of the non-essential information, keep important patterns?
- Many times we care about relative change, like in pricing
- Or group data points together (clustering is an advanced form of this)
- OK, let's get into some specifics:
6 GIS two_col
- Geographic Information Systems
- Analysis and visualization of geographic data
- Search, terrain, object detection, flow calculations
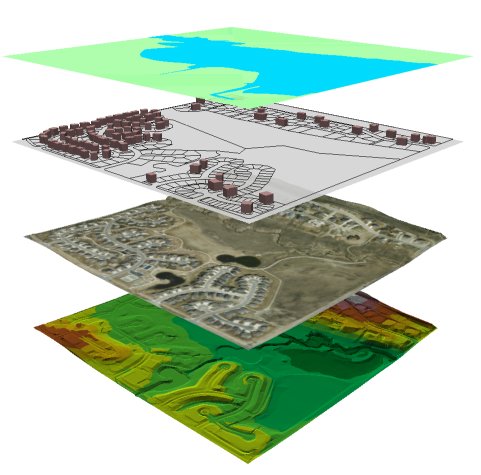
7 Spatial Databases
- Integrates spatial information with traditional DBMS operations
- Spatial indexing, distance metrics, polygon definitions, layering
- Eg: Oracle Spatial Data Cartridge, ESRI Spatial Engine
8 Discovery
- What are examples of efficient city layouts?
- What influences successful business centers?
- Deforestation rates
8.1 Ideas notes
- City layouts: Understanding home->work distances, not Euclidean, but traffic on streets or by public transportation, recognizing traffic jams
- Business centers: analyzing network flow based on roads: industrial supply centers nearby? Creative centers, restaurants, nightlife?
- Deforestation: nearby cities' effect? Recognizing forested areas vs clear cut. Time series
9 ATM Locations given obstacles center
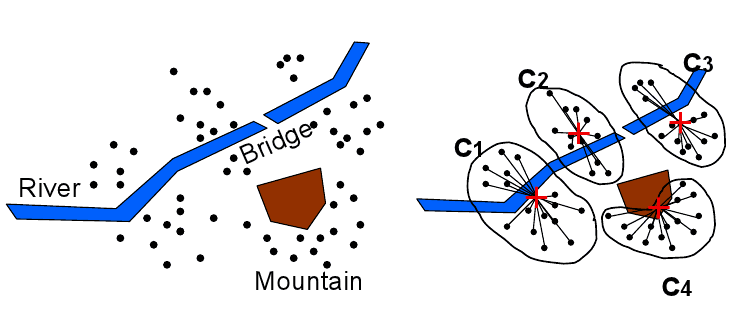
9.1 Yelp notes
- This is a current area we could improve at Yelp:
- Just because you're a mile from a restaurant doesn't mean it is "close"
- Maybe across the Bay, or maybe in between metro stops
- How can you calculate efficiently?
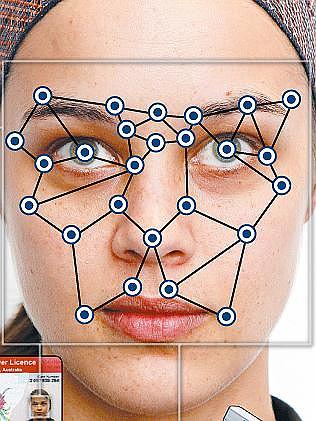
10 Images two_col
- General Feature Extraction
- Sketch Recognition
- Image Recognition

10.1 Covering notes
- We'll cover some interesting ways to extract dimensions
- ML/data mining combine these dimensions to do recognition with, eg. labeled data
- Image on the right is using an algorithm to pick out, then filter "interesting" points on the image
- img: http://en.wikipedia.org/wiki/Scale-invariant_feature_transform
11 SIFT
11.1 Process notes
- Successively apply Gaussian blur to image
- Find points which "stand out" between blurs (ie big differences)
- You can connect these keypoints to make a kind of fingerprint
- These fingerprints can be used, scaled, etc. to match against other images
12 Sketch Recognition center
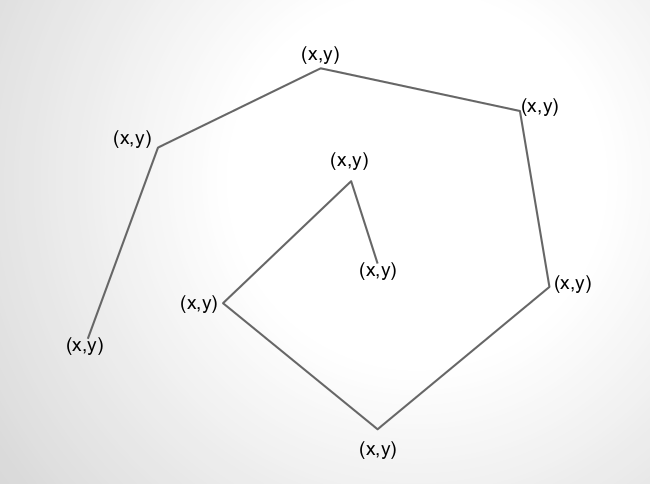
- Find (x,y) points along a sketch
12.1 Why? notes
- Sketch recognition can be used to see if you're drawing shapes
- Be nice to be able to snap a picture of your diagram on a napkin and have it come out nicely formatted?
- But how to recognize a circle, assuming you can't draw a perfect circle?
- Start with (x,y) points, but as we mentioned, very sparse
- Images by Marty Field
13 Direction center
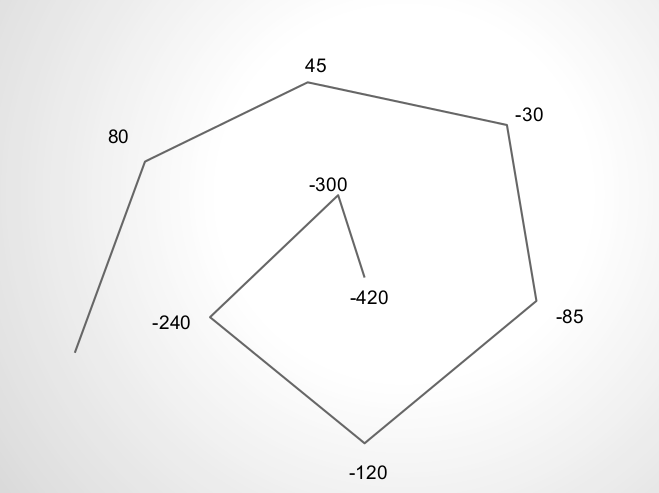
- Find angles along a sketch
13.1 Angles? notes
- Instead of points, measure the angle at each turn
- You'll notice something peculiar about these angles. What?
- They're more than +/- 180 because we want to continue a "trend" if they're turning the same way. Help identify changes in direction vs spirals
14 Direction Plot center
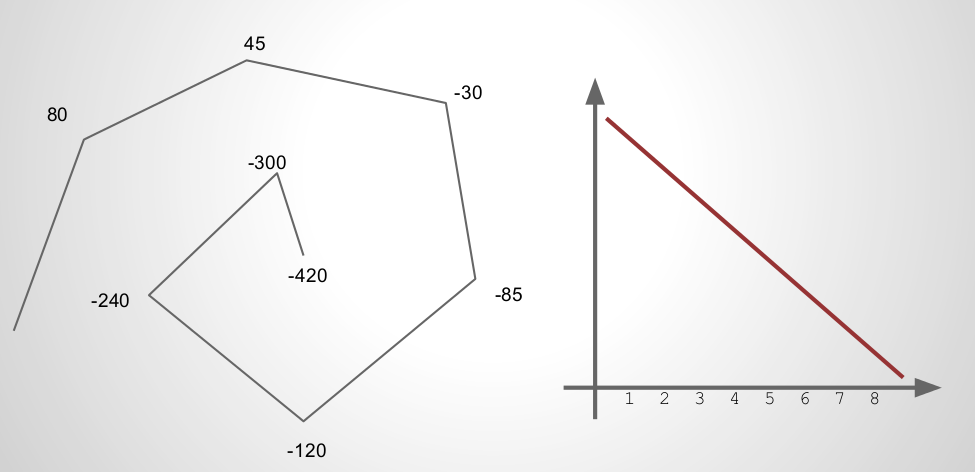
- Plot angles vs time
14.1 Why? notes
- Becomes even more generalized:
- What is the derivative?
- How many times to we change derivatives?
15 Direction Plot center
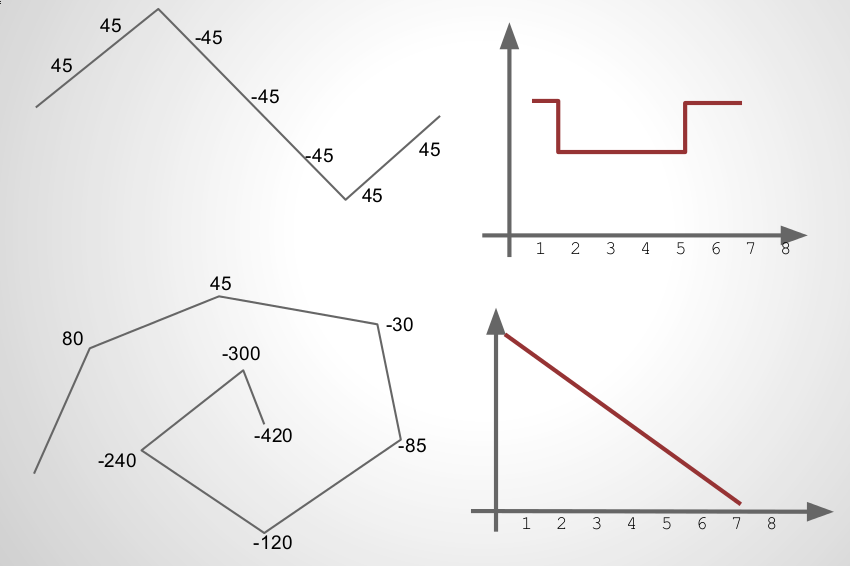
- Plot angles vs time
15.1 Why? notes
- Example where we change directions
16 Features center
- NDDE
- Normalized Distance between Direction Extremes
- DCR
- Direction Change Ratio
16.1 Why? notes
- NDDE
- Are the discontinuous changes in direction, or is the line
- generally curvy, and follows a similar path?
- DCR
- Total amount of angle change in the sketch. Low for first, high for second
- Others?
- bounding box size/ratio, stroke length, distance between endpoints, length, width, height, speed, direction, acceleration
17 All Together Now
18 Music
- Generate a finger print: time, frequency, amplitude
- Filter most intense (largest) amplitudes
- Create a hash of connections between points
- Match, in time, the hash between songs
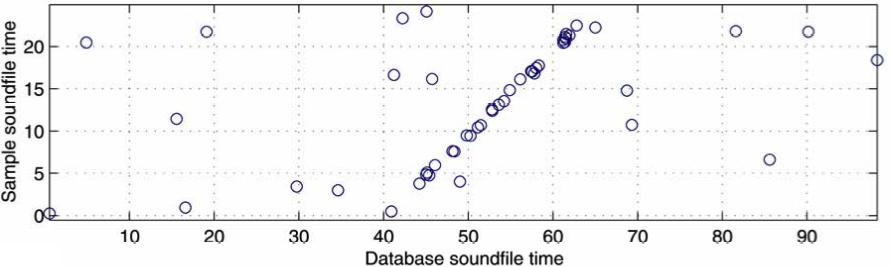
18.1 Relation to Images notes
- Interesting to note: we transformed one media type (music) into another (image), then started using some techniques we've seen in image fingerprinting
- More in reading