2013-04-26-Outliers
Table of Contents
1 Outliers
2 Generative Model animate
- "Real" model that produced original data points
- Our mission is to reproduce the original model
- Thus we have different techniques that can model different behavior
2.1 Questions notes
- What is a "generative model"?
- What is data mining trying to discover? What is machine learning hoping to reproduce?
- Why have different classifiers? Decision tree, Naive Bayes, etc?
3 Outliers two_col
- Significant deviation
- Probably generated through a different model than the rest of the data
- Normal / Abnormal

3.1 Intuitive notes
- We all have a pretty good intuitive understand of what outliers are
- Mathematically, you can express the variation as a different generative model
- Normal / Abnormal data (be careful about using it in human contexts)
- img: http://enriquegortiz.com/wordpress/enriquegortiz/research/undergraduate/
4 Outlier Types
- Global
- points which deviate from the rest of the entire data set. Point anomalies
- Contextual
- points which deviate from their peers. Conditional outliers
- Collective
- points which deviate as a group, even though individual points may not be considered outliers.
5 Which Type?
- Given class sizes at Berkeley:
- A day with 10 people in class
- A day with 7000 people in class
- 3 weeks of 15 people in this class
- Given Earth's temperatures:
- A day at 100°C
- 30 straight days of rain in Berkeley
- A day at 100°F
6 Types of Learning two_col
- Supervised
- Unsupervised
- Semi-Supervised
![]()
6.1 notes
- Supervised
- learning from "gold standard" labels
- Unsupervised
- learning without labels
- Semi-Supervised
- infer more labels from a few, learn based on inferred + labeled
- img
- https://www.coursera.org/course/ml
7 Outlier Methods
- Supervised
- Label outliers, treat as classification problem
- Unsupervised
- Cluster data, find points not clustered well
- Semi-Supervised
- Manually label few, find point nearby to automatically label, then treat as classification
- Statistical
- Decide on a generative model / distribution, find points which have a low probability of belonging
- Proximity
- Use relative distance to neighbors
7.1 Features notes
- Some methods may be overlapping
- When developing features for classification, using relative features can be helpful: eg. distance from mean
- Eg. Agglomerative clustering, find lone/small groups that are last to glom together
- Eg. k-means find points which are "far" out from centroids
- Determining "far", "last" can be application specific, part of the challenge
- What algorithm could we use to automatically label nearby points? k-nearest neighbor
- Statistical: Again, must define "low" in your domain
- Proximity: basically translating features into another, relative, space, then applying a different type of outlier detection (eg. statistical)
8 Statistical
- Assume a distribution
- Determine parameters
- Calculate probability of a point be generated by distribution
8.1 Why Statistical notes
- We've covered supervised, clustering, so let's skip to statistical methods
- Most straight forward way is to use distributions
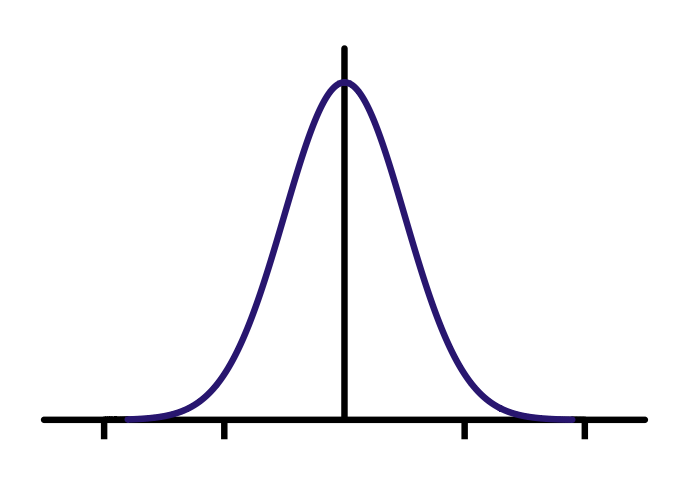
8.2 Statistical Example two_col
- Assume normal distribution
- Determine mean and standard distribution
- If
(point-mean)/stddev > 3, consider outlier
8.2.1 Pros/Cons notes
- Straight forward
- Can use % to intuitively motivate (3 stdevs is outside 99.7%)
- But must manually determine cut-off
- How do we know we got the parameters right?
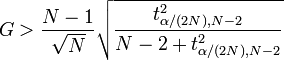
9 Grubb's Test
- Takes into account sample size; reliability of mean/stddev measurements
- Take Z-score of a point, assign to
G - Student t-test: used to measure the distribution of actual mean from a sample
9.1 Pros/Cons notes
- Z-score:
abs(x-u)/s - This isn't actually that different from measuring stddev
- But accounts for sample size, can express your confidence with alpha 95% (0.05)
- Not going to go into t-test/t-distribution here, but basically it helps show where the mean likely is, given a set of sample data.
10 Outlier Distance animate
- How to take outliers in > 1 dimension?
- Translate distance to 1 dimension, find outliers
- How to measure distance?
10.1 Limitations notes
- What are the limitations of the techniques we've seen?
- Limited to one dimension! Taking mean, stddev, etc. applies to 1 dimension
- Euclidean: doesn't take into account dependent variables
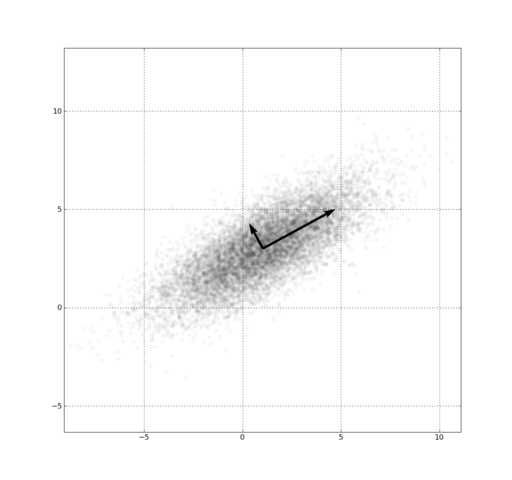
11 Mahalanobis Distance two_col
ydepends somewhat onx- Euclidean distance measures all dimensions equally
- Use covariance matrix to normalize distances in each dimension
- Matrix in which
E_i,jis the covariance ofi,jdimensions
11.1 Mahalanobis notes
- How to capture intuition that a distance along major axis is different than along this minor axis?
- Expand this drawing into 3 dimensions
- Euclidean distance will equally weight something that is out in the
zdirection as something that is along this primary scatter area
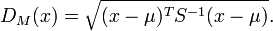
11.2 Mahalanobis Definition
- Find mean vector
- Normalize by covariance
11.3 Some Math notes
- Some extra math tricks to make the units work out:
- We're taking the squared distance, then taking the square root
- DM has squared Mahalanobis distance defined
- What happens if we have no covariance? S is the Identity matrix
12 Contextual Outliers
- Typically reduce scope to context, use global techniques
- Example: Calculate normal distribution for Berkeley weather
- Collective outliers: find collections, use as context