2013-05-03-Visualization
Table of Contents
1 Visualization in Data Mining
2 Your Brain two_col
- Pattern detector
- Visualizations help you search for possible models
- Help intuitively understand the data
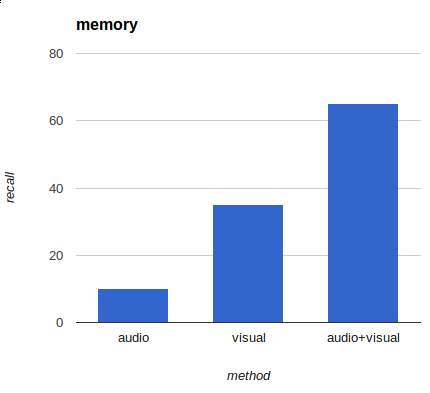
2.1 Visual notes
- Most people, vision is the strongest sense
- Recall improves 55% (10%=>65%) with addition of a picture
- We've talked about the need to understand the data before using algorithms on it. Visualization can speed that process up.
3 Patterns
- Use visualizations that surface patterns and relationships
- Know the context for the visualization
- Verify results
3.1 Steps notes
- For gaining intuition, focus on simple visualizations that help you see relationships in the data.
- At this time, labels, titles, etc. not very important. Multiple dimension in multiple windows? Fine!
- We'll discuss, but the context a visualization is going to be used in matters a lot. Don't feel like you have to import every cool infographic into your project
- Clustering, classification, outlier selection can be verified visually, eg. highlighting points. Use it to gut check conclusions, even if you have to drastically reduce dimensionality
4 Scatter
- Great for multidimensional data
- Just plot > 2 dimensions in different plots
- Reveals correlation, clustering, distribution, …
4.1 Data Mining notes
- DM bread and butter. Often deal with high dimensionality, so scatter is one of the best ways to visualize
- Wide variety of patterns can be searched
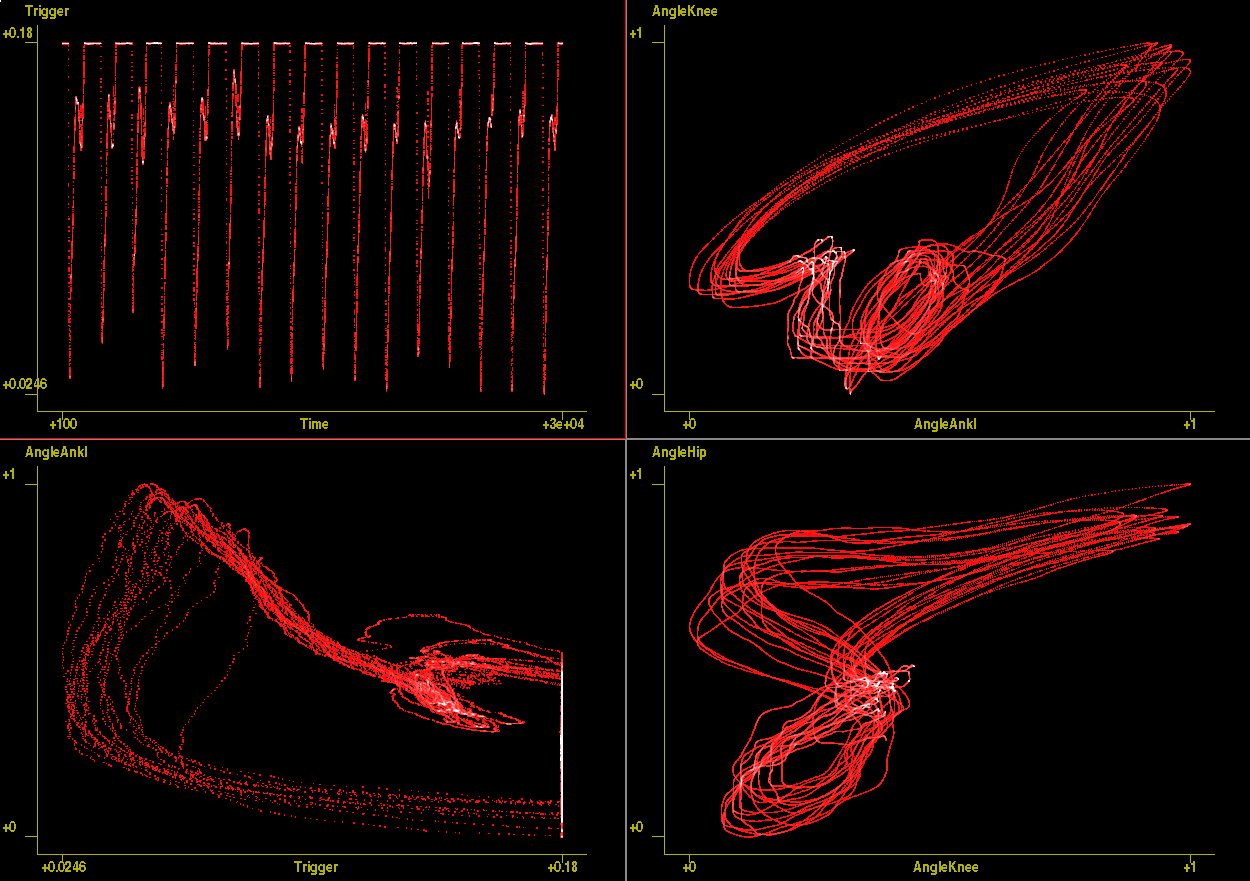
4.2 Multiple Dimensions center
4.3 vp notes
- This data is for body positions over time
- Dimensions are the different angles for different body parts, like hip ankle, knee, over time
- We can see some strong patterns. Maybe we'll need to kernelize them to make them learnable, but we have a good understanding that there are, or are not relationships between the data
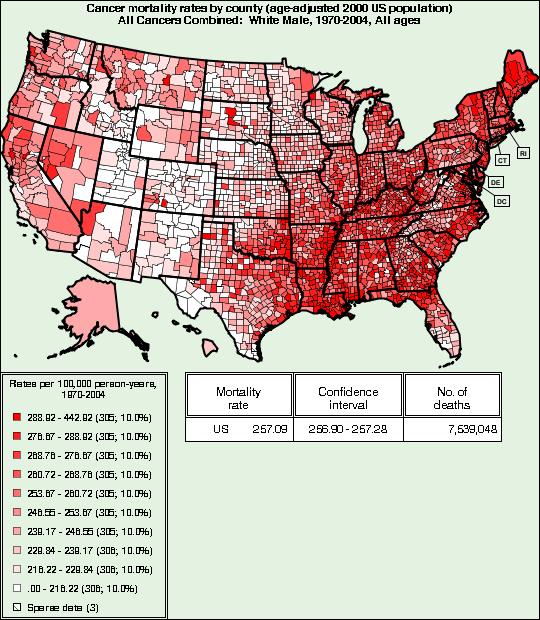
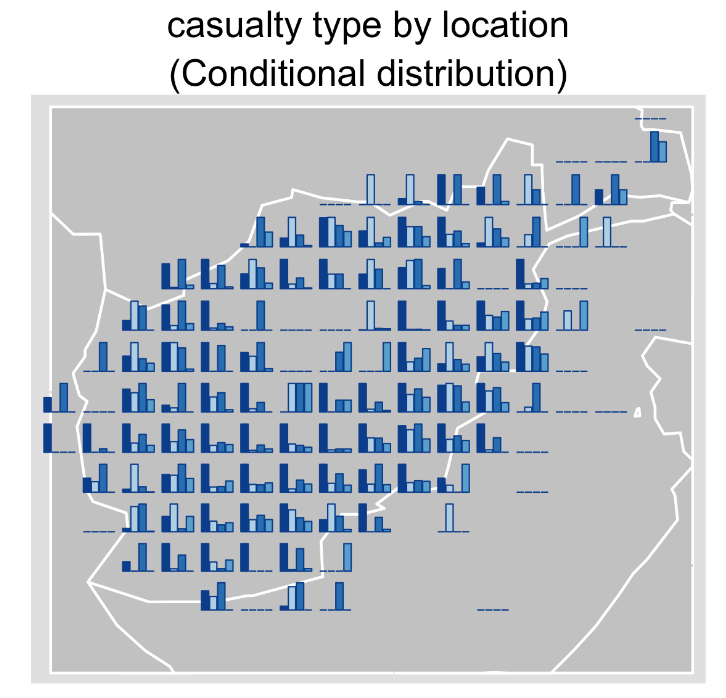
5 Geographic
5.1 Trade-offs notes
- Coordinates intuitively understandable
- Lots of ways to bucket/aggregate
- Dependence on geographical area (eg. when you'd like to depend on human impact instead)
6 Other Chart Types
- Box plot
- aggregate data
- Bar charts
- simple summaries
- Pie charts
- compound proportions
6.1 Types notes
- Box plots, for real data, still carry a lot of data
- Bar charts nice for summarizing, not great for exploring
- Same for pie charts. Pie charts are mostly bad, but can use in particular circumstances
7 Aesthetics
- The visual aesthetics you use should be tied to the data
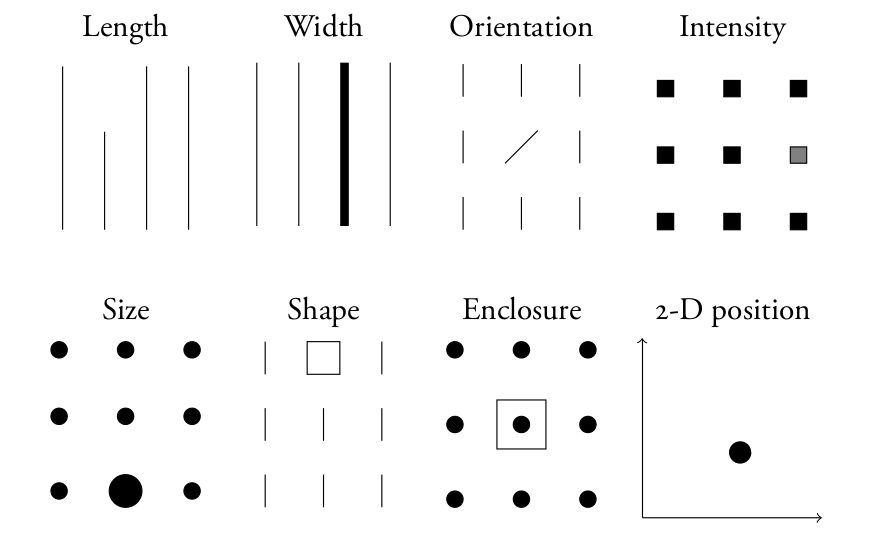
7.1 Aesthetics notes
- What are some of the techniques we can use to tie data to a visual representation?
- img: Kevin Lynagh, http://keminglabs.com/talks/
7.2 Larger Value?
- Position
- Length / Angle
- Area / Volume
- Color: Chroma Luminance
7.3 Slide Switch notes
- Hadley Wickham slides, OSCON
8 Color: HCL two_col
- Hue
- color type, relative to RGBY
- Chroma
- colorfulness, perceived color intensity
- Luminosity
- brightness, light-dark
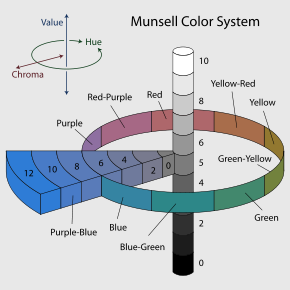
8.1 Color Spaces notes
- Many other color spaces, probably most familiar with RGB
- HCL is useful because it separates the properties of a color into ones that can be mapped to data
- Hue: nominal, can't compare
- Chroma, Luminosity: numerical / comparable value
- Chroma vs Saturation: chroma perception relative to white, saturation measure of color intensity
8.2 ColorBrewer
- http://colorbrewer2.org/
- Type of comparison => type of color difference
- Lots of other practical features
9 Careful
- Some aesthetics can combine to form illusions
- http://www.michaelbach.de/ot/sze_sineIllusion/
9.1 Line Lengths notes
- Line lengths can appear to look smaller when extended instead of right next to each other
9.2 Careful
9.3 Careful
10 Grammar of Graphics
- Geom
- Graphic element
- Aesthetics
- appearance of a geom
- Data
- raw, context, statistical aggregations of data
- Mapping
- functions which map data to geom properties or aesthetics
10.1 Bringing Together notes
- We've talked about different aesthetics of showing data, we've talked about data, all that's needed is to bring them together
- Wilkinson, L. (2005), The Grammar of Graphics (2nd ed.). Statistics and Computing, New York: Springer.
- Rigorous way of describing graphics beyond "scatter plot" or "bar chart"
11 Scatter Plot animate
- Geoms?
- points, tick marks
- Data?
- temperature, sales
- Mapping?
- sales -> y, temp -> x
- Note, not a simple 1:1 mapping, we must map to something visual, like pixels
11.1 Ice Cream notes
- Plot shows hypothetical sales of ice cream vs temperature
- Geoms: points (actually, ticks are geoms, too)
- Data: sales, temperature (and context: how large is the potential plot size)
- Mapping: sales
- img: http://www.mathsisfun.com/data/scatter-xy-plots.html
12 Bar Plot animate
- Geoms?
- rectangles (ticks, text)
- Data?
- Fruit to popularity
- Mapping?
- popularity -> height, fruit type -> x, color
12.1 Fruit notes
- Plot shows fruit popularity
- Geoms: bars (and ticket, text)
- Data:
- Mapping: sales
- img: http://www.mathsisfun.com/data/bar-graphs.html
13 Hipmonk
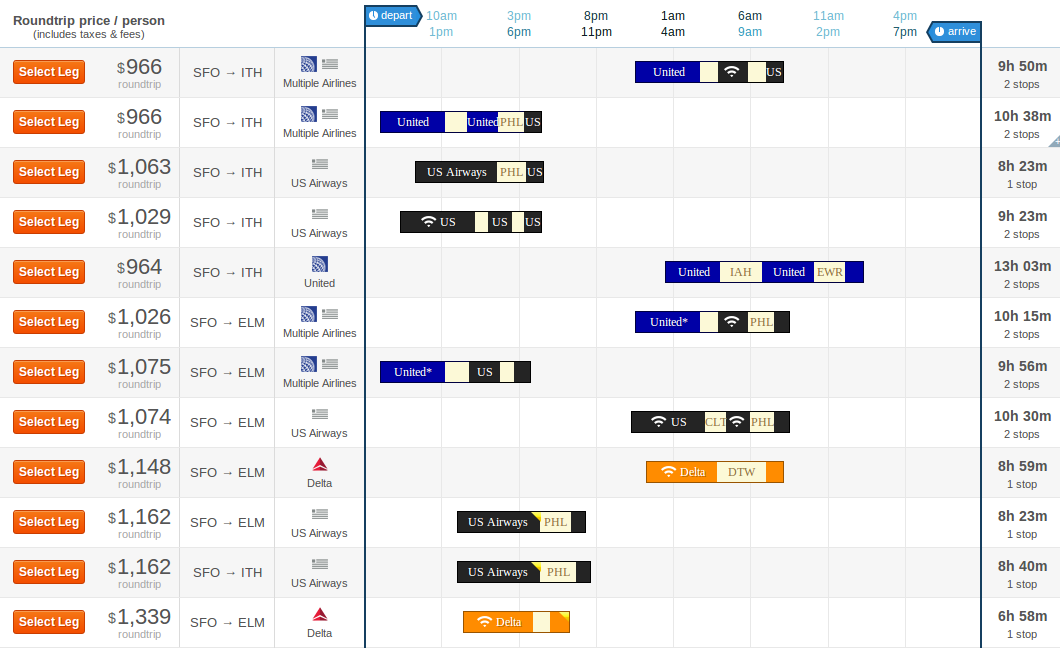
- Geoms?
- rectangles, text, ticks,
- Data?
- Carrier, flight time, layover time, cost, wifi available, airports
- Mapping?
- travel time -> bar length, flight times -> sub-bars, "agony" -> y, airline -> color
13.1 Fruit notes
- Shows travel options from SFO to Ithica, connecting flights, airports, etc.
- More complex, but still expressible via Grammar
- img: http://www.hipmonk.com
14 Recursive
- Geoms?
14.1 Complex notes
- Reading will go a further extension of this, where the geoms are themselves other plots
15 Tufte
- Clarity from data
- Avoid chart junk
- Techniques for displaying many types
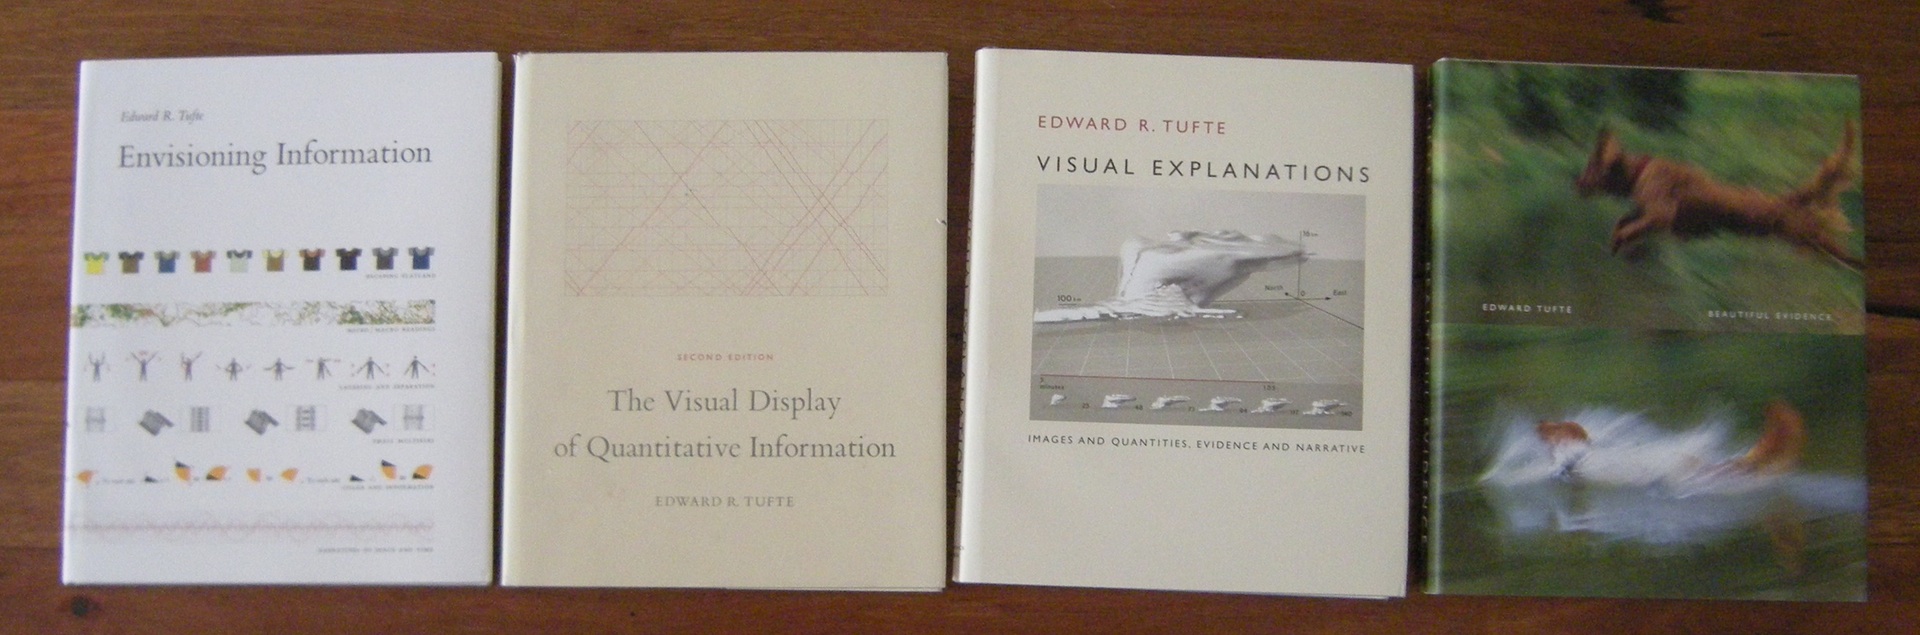
15.1 Tufte notes
- No talk on visualization would be complete without mentioning Tufte
- Great examples