2013-05-03-Yelp-Visualizaiton
Table of Contents
- 1 Visualizing Data at Yelp
- 2 Visualizing Data is Important
- 3 Visualizing Data is Difficult
- 4 Birth of a City
- 5 Cool
- 6 Avoid Chart Junk
- 7 Grapperr
- 8 Actionable
- 9 Dimensions
- 10 A Tale of Two Datacenters
- 11 Firefly
- 12 Easy
- 13 Easy from Simple
- 14 Search Maps
- 15 Interactive
- 16 Creation
- 17 D3: Data-Driven Documents
- 18 Flexible
- 19 Dimensions
- 20 Understand Usage Context
- 21 Dimensions
1 Visualizing Data at Yelp center
2 Visualizing Data is Important
- Effectively summarizes data
- Highlights patterns
- Improves recall
2.1 Metrics notes
- Can't improve something till you measure
- True, but have to look at and understand the data!
- Often best way to understand data is visually
- Having metrics you care about evident will make you focus on improving them
- More sophisticated your visualizations, more sophisticated your goals
3 Visualizing Data is Difficult
- Requires investment
- Dimensions of success
- Successful visualizations in Yelp
3.1 Role in Yelp notes
- Often requires specific domain knowledge of both the data and the tools
- Moving to a new office
- Ideally have 2 big screens per pod
- "That's a lot of TVs!"
- Get motivated everyday
- Show what you care about
- Don't want a sterile office, decorate with the results of your work
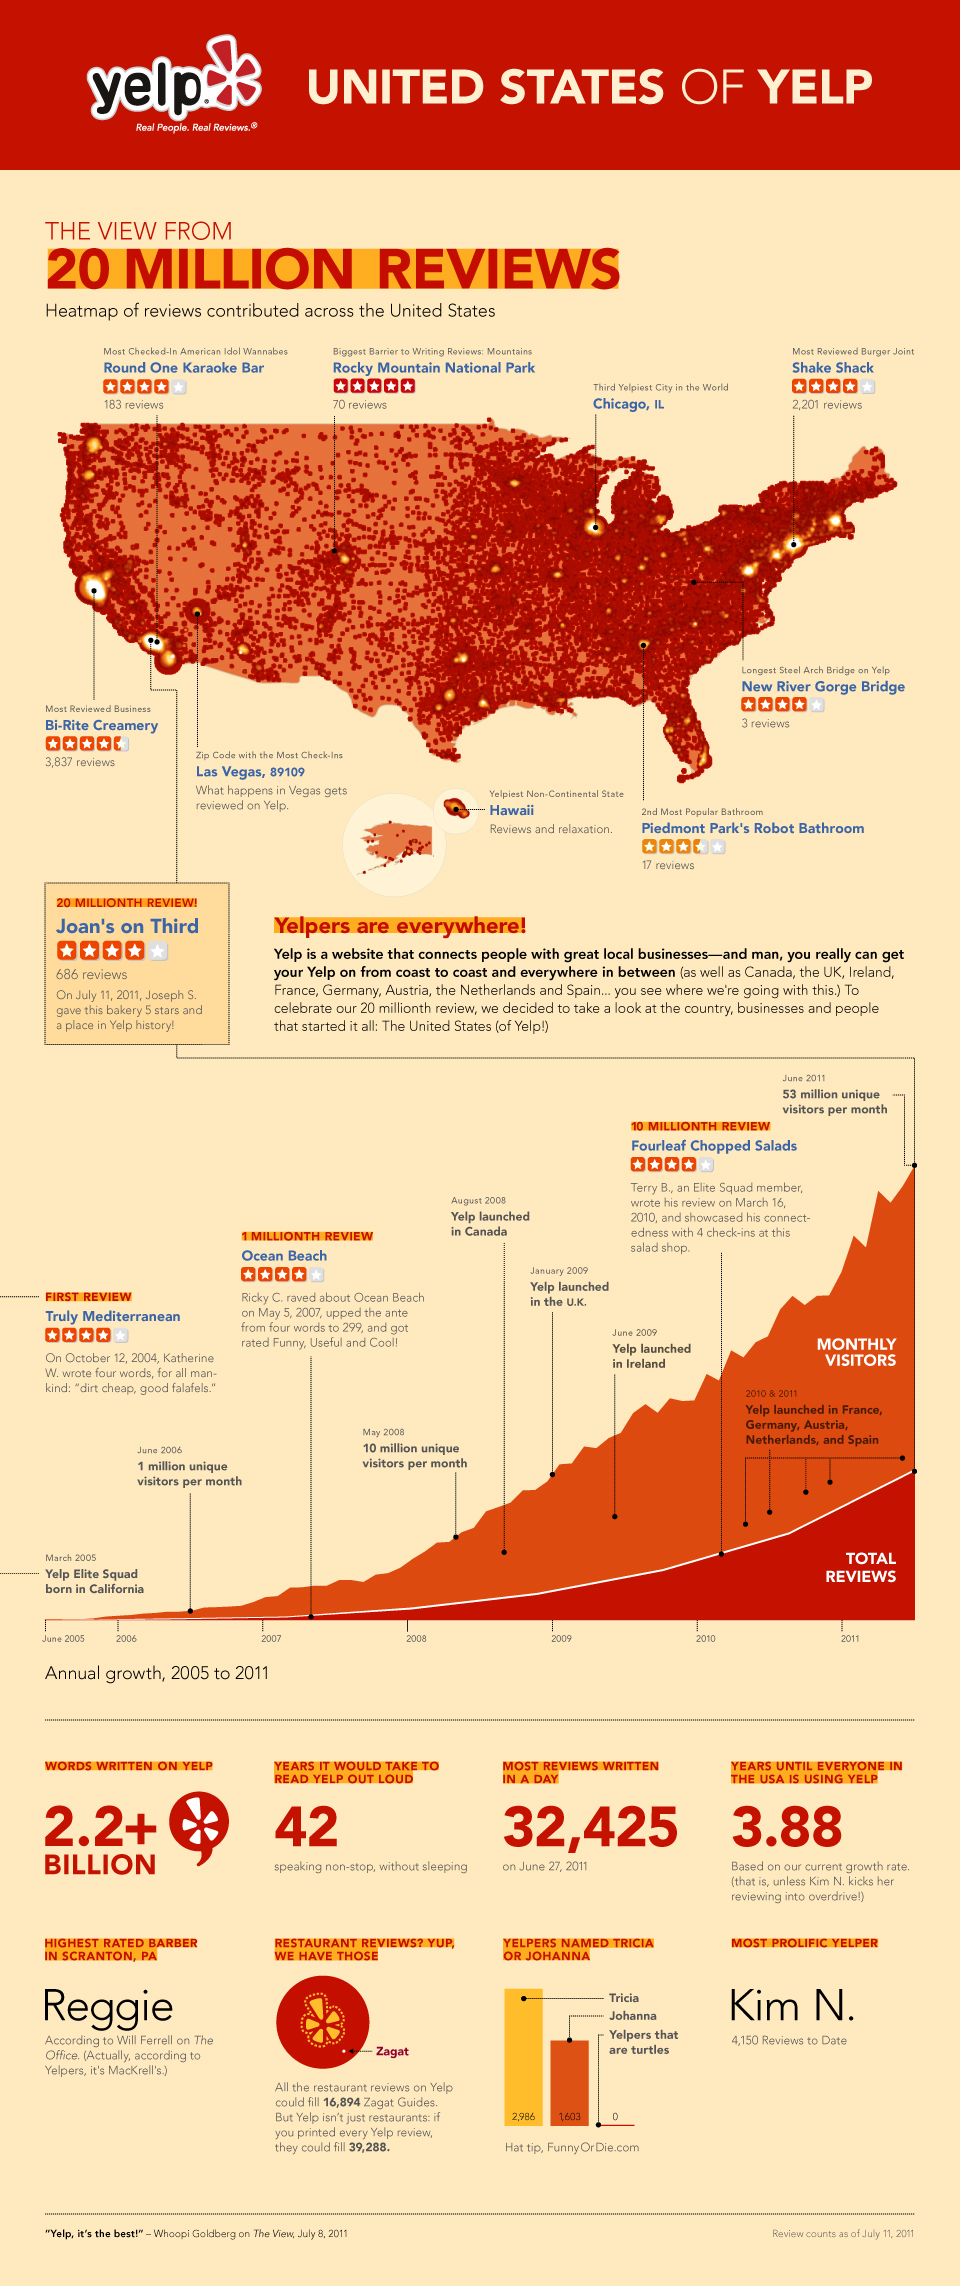
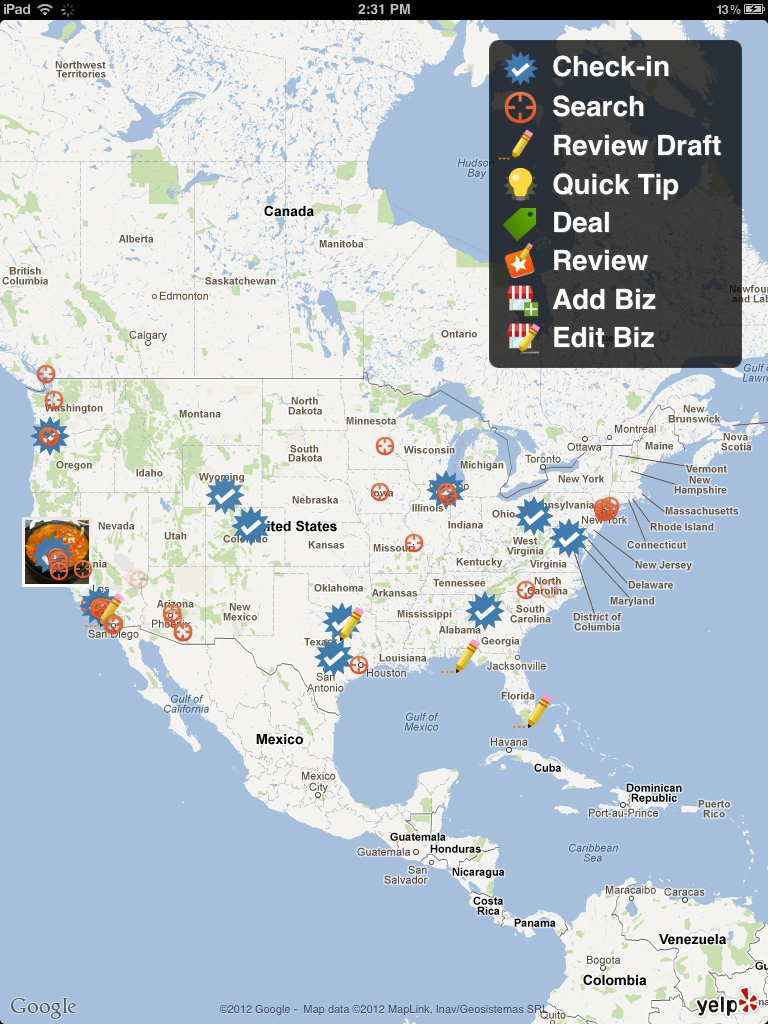
4 Birth of a City
4.1 Review activity over time on a map notes
- Written as part of Yelp's quarterly Hackathons
- A lot of feedback from our Community Managers on understanding their city
- Demonstrable value to advertisers
- But main feature is… Cool
5 Cool
- Good looking is a dimension of any visualization
- We want to be Neo or John Anderton, not Milton

5.1 Cool is OK notes
- Engineers need to come to grips that to be visually compelling, a visualization needs to look nice
- Just like the most compelling novels need to be well written
- We realize this, we just don't like to admit it
6 Avoid Chart Junk two_col
- Edward Tufte rightfully suspicious of cool
- Worry about
data/inkratio - But remember tradeoffs: memorability, fun
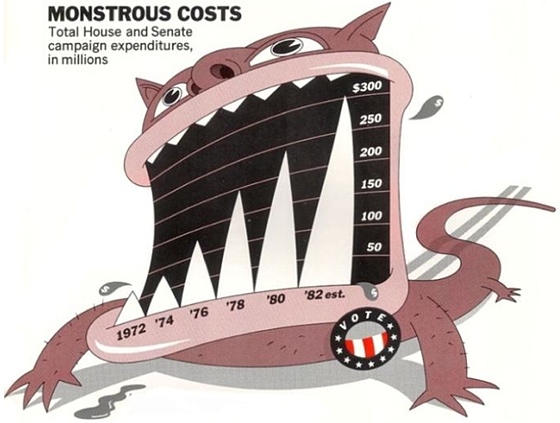
6.1 Useful Junk? notes
- Data/ink ratio describes the amount of information displayed per ink/pixel
- If you remove a pixel, will you remove information?
- Best Paper by Scott Bateman HCI: some useful Junk
- Noted the context of the chart
- Bad ratio limits richness, especially important on mobile
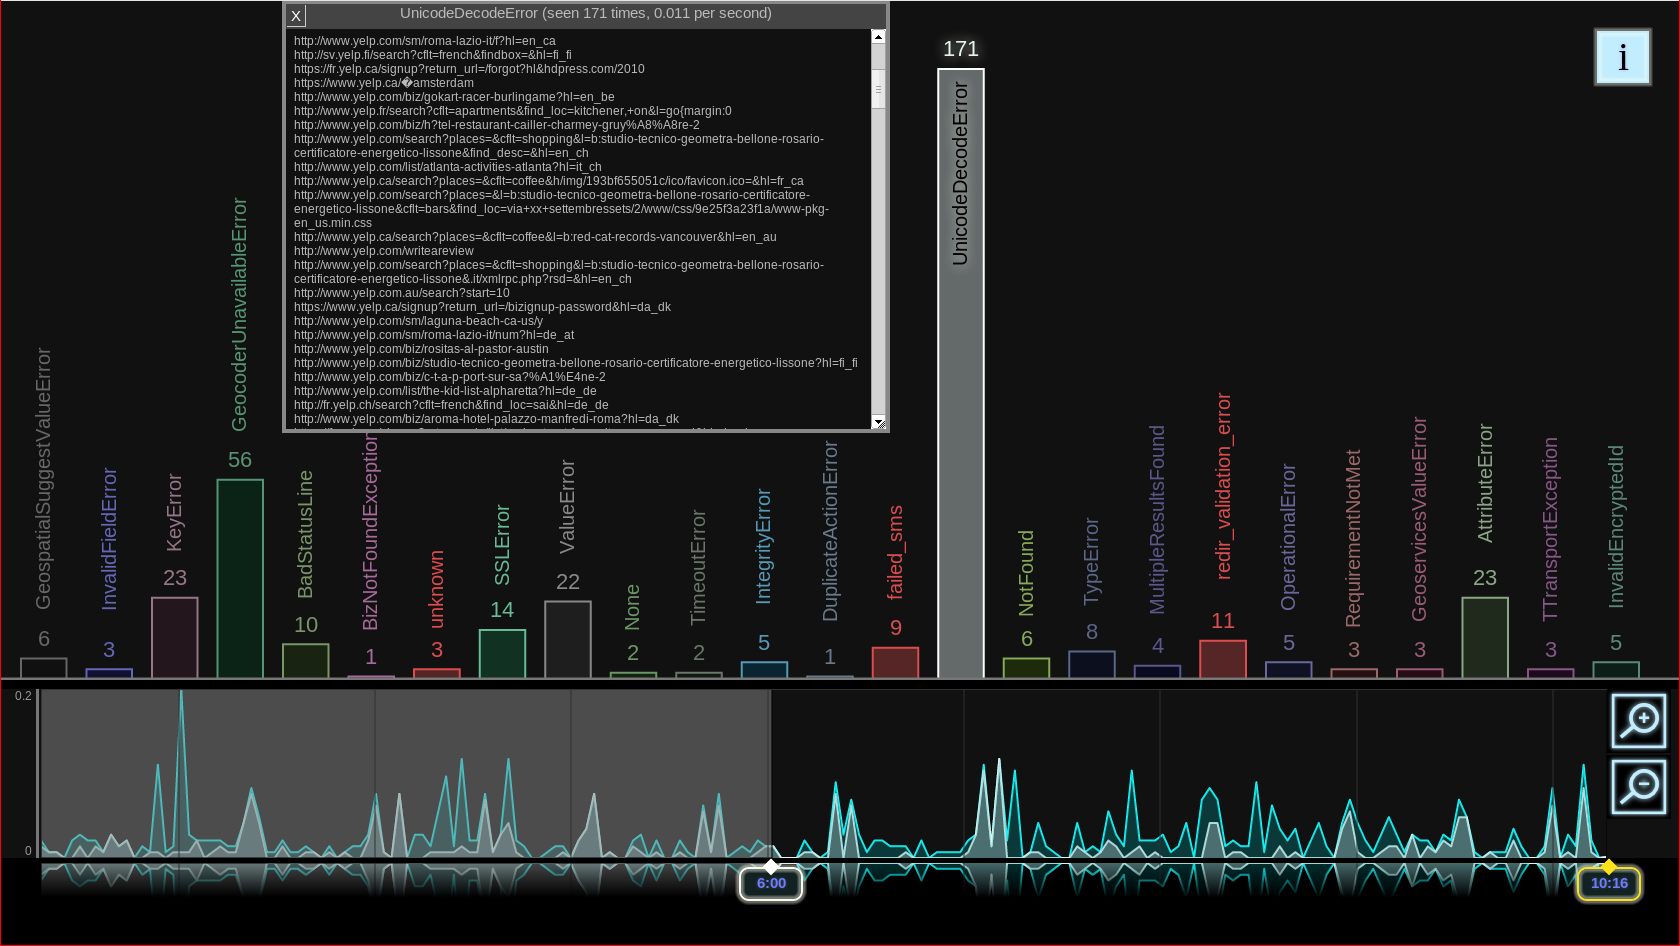
7 Grapperr
7.1 Shows errors live from log notes
- Error activity
- Highlight error type UnicodeDecodeError
- Text details available
- Still Cool!
- Colors slick, modern
- But used for differentiation (data)
7.2 Grapperr Snapshot
8 Actionable two_col
- Realtime*
- Context
- Connections

8.1 Definitions notes
- As realtime as problem domain requires
- Seconds matter when fixing site problems, so should be up to the second
- Days or weeks might matter when deciding budget issues
- Context: Is this a normal amount of errors?
- Connections: Ability to drill down to specific instance
9 Dimensions
- Fun
- cool, pretty, engaging
- Actionable
- realtime, contextual, connecting
9.1 Agenda notes
- Dimensions important to visualizations
- Axis on which you can evaluate them
- Tradeoffs in developing them
10 A Tale of Two Datacenters
- Testing datacenter failover
- Tracking metrics in a new way
- Did we spend a week preparing a dashboard?
10.1 How? notes
- Yelp used to be in only one datacenter
- Moving to two datacenters is a huge undertaking, but worth it for reliability reasons
- Don't want to bring down a worldwide site when freak electrical storms hit your datacenter
- After months of work, how did watch over our site when we finally flipped the switch?
- This was the first time Yelp had done this: we didn't have a premade dashboard so everyone could track the important metrics
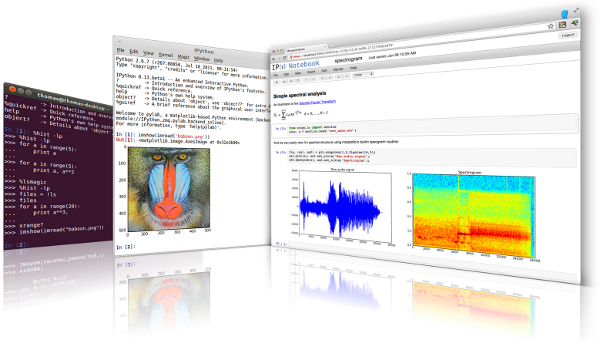
11 Firefly
11.1 Demo notes
- One of our many open source projects
- Hosted on Github
- Existing extension to Ganglia
12 Easy
- Make repeated operations fast and within reach
- Must understand problem domain
- Accessible
12.1 Definitions notes
- Sophisticated Tool: Data discovery, stacking options, coloring, layout
- But all of the steps are repeated, formulaic: we're making similar things over and over
- So make it easy!
- Not much more accessible than Web: share links, etc.
13 Easy from Simple
- Avoid temptation to make visualizations easy from the start
- Easy systems are designed for non-experts
- Long term investment in the system to manage complexity
13.1 Non-experts notes
- Simple Made Easy, Rich Hickey
- Still potentially technical users
- Just don't know the details of how metrics are collected, or how to display across browsers
- Always will require experts to make changes
- Always are going to want new features
- Make sure you have the ability to add them
- Not extensible
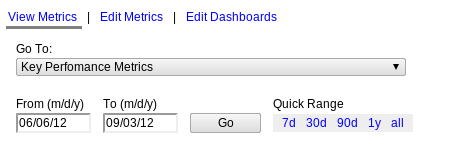
14 Search Maps
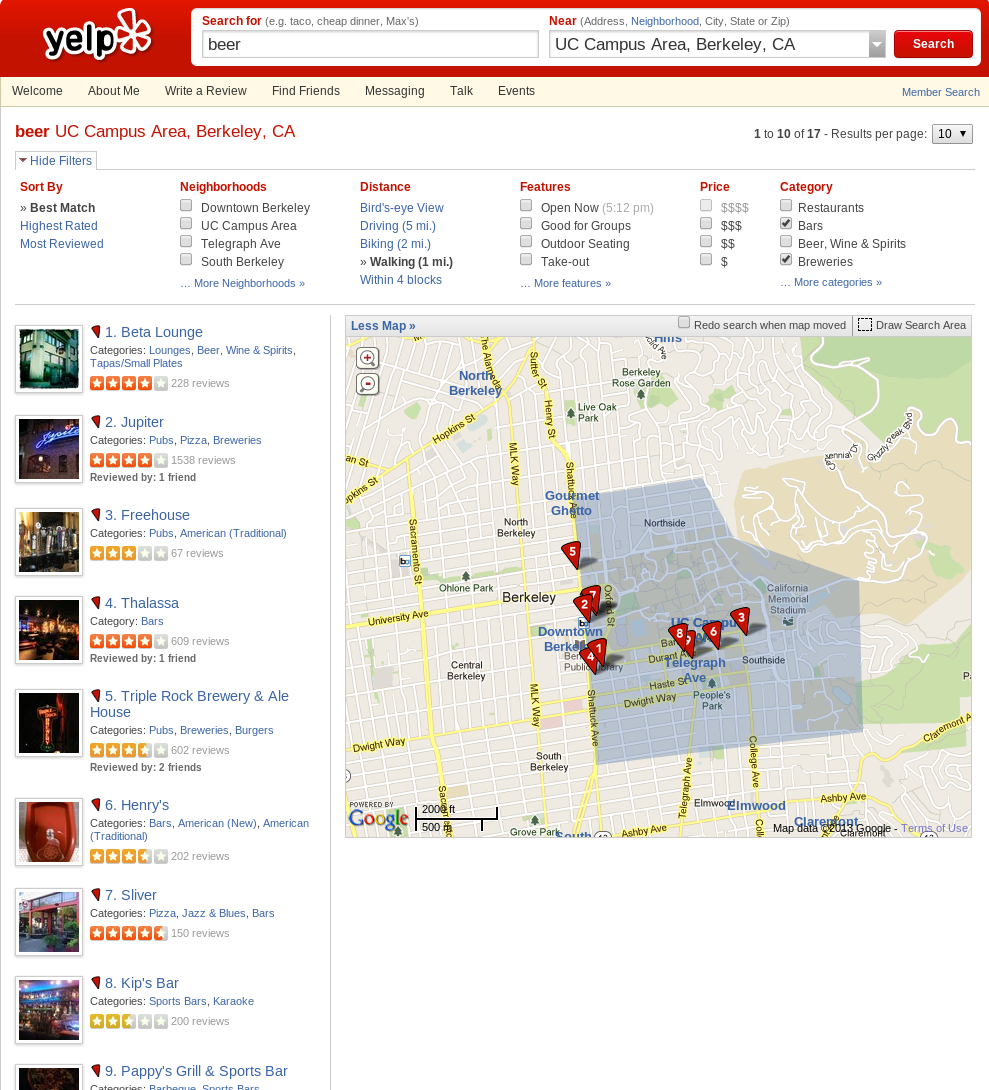 Mo' Map
14.1 Times Change notes
- 2005, 8 years ago
- May not seem like important visualization, but times have changed
- Full page refresh for each map square
- Now we take zoom in, panning for granted
- Sign of a great visualization: don't think about it: it's a tool
- What else are we not plotting on maps that we should be?
15 Interactive two_col
- Fast
- Explorable
- Feedback
15.1 Definitions notes
- Fast
- One of the reasons its a fairly recent technology, hard to get fast
- Speed gives the UI illusion that you are interacting with a physical thing, something we're much more comfortable with
- Explorable
- Multiple levels of detail that can be discovered by user
- Feedback
- Update all other dependent displays (search results)
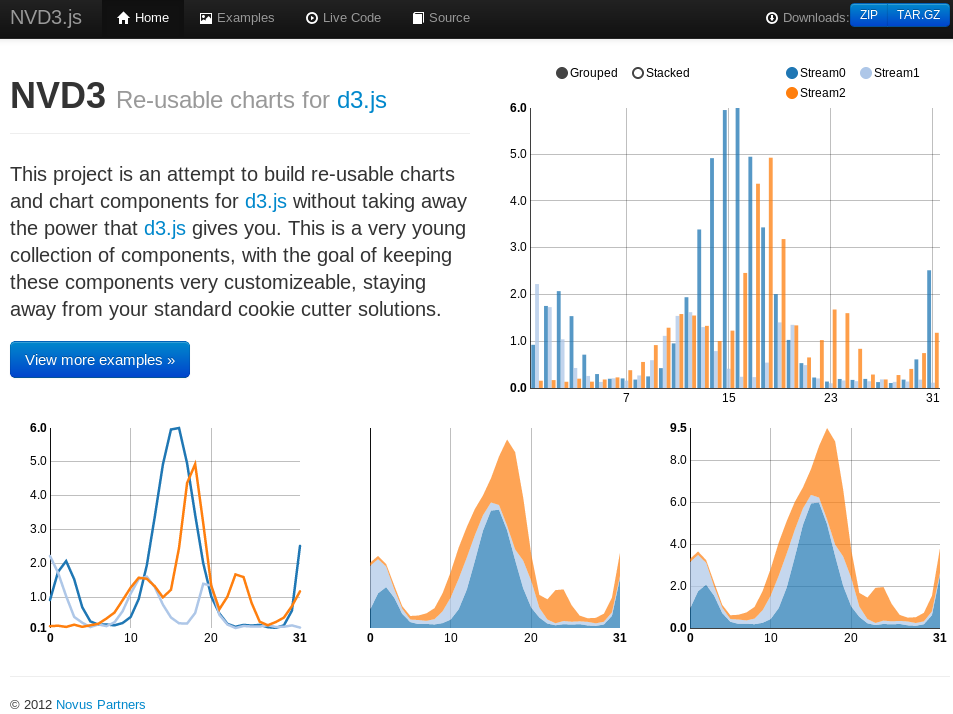
16 Creation
- Michael Bostock had a problem
- Protovis useful, but not flexible
- How to provide coherent description for visualizing data?
16.1 D3 Intro notes
- Mike Bostock professor at Stanford
- Protivis was a declarative Javascript charting library
- But hard to keep up with changes in technology
- Wasn't quite flexible enough for new visualizations
17 D3: Data-Driven Documents center
D3 Show Reel from Mike Bostock on Vimeo.
18 Flexible
- Language level
- Access to medium
- Access to data
d3.selectAll("p")
  .data([4, 8, 15, 16, 23, 42])
  .style("font-size",
    function(d) { return d + "px"; });
18.1 Why? notes
- Metaphor natural language
- General language most flexible tool humans have to describe new things
- Full access to medium to be able to create take advantage of all possibilities
- and new tech
- Not D3 specific, but need full data to find new ways to summarize, explore, drill
- Need to understand where data came from to clean, normalize
19 Dimensions
- Fun
- cool, pretty, engaging
- Actionable
- realtime, contextual, connecting
- Easy
- available for non-experts, remove repetition
- Interactive
- fast, explorable
- Flexible
- expressive, full access to lowest level
19.1 Tension notes
- Obvious: Flexible vs Easy. Too many options is confusing.
- Less obvious: Interactive vs Actionable. Spend too long playing, not enough fixing
- In fact: All in contention for your time
20 Understand Usage Context
20.1 Press: Fun
20.2 Alerting: Actionable
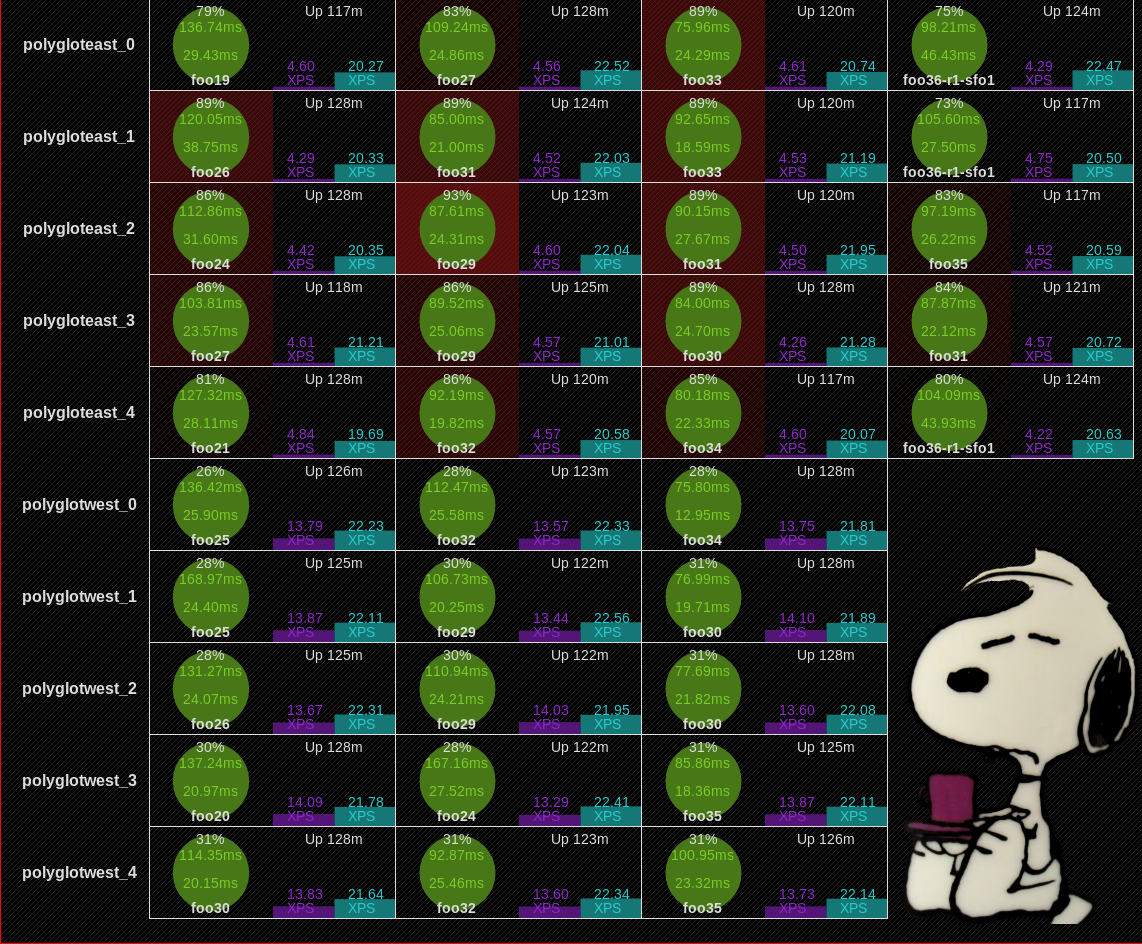
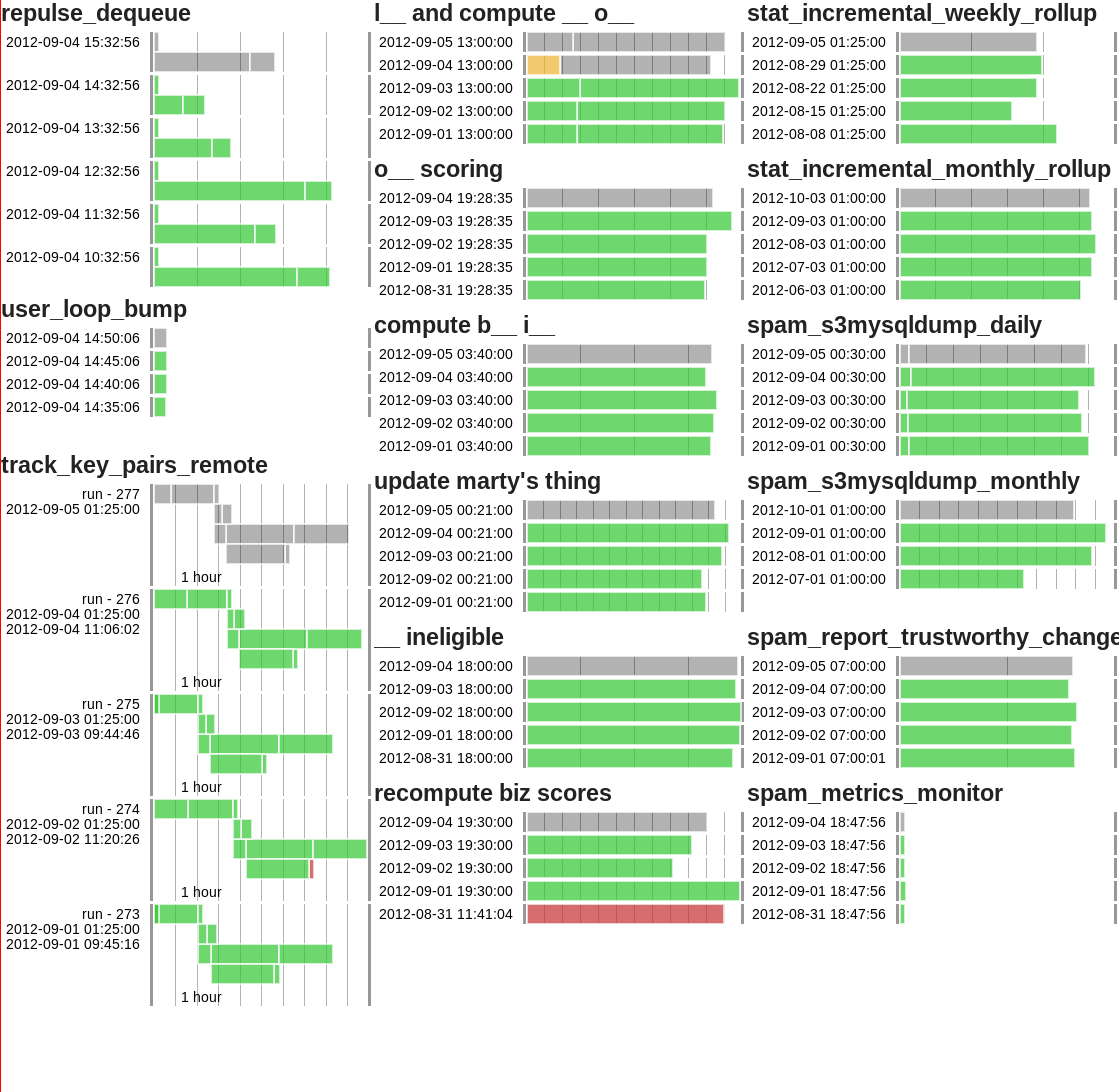
20.3 Search Metrics notes
- This is a visualization of the status of our search cluster
20.4 Product Managers: Easy
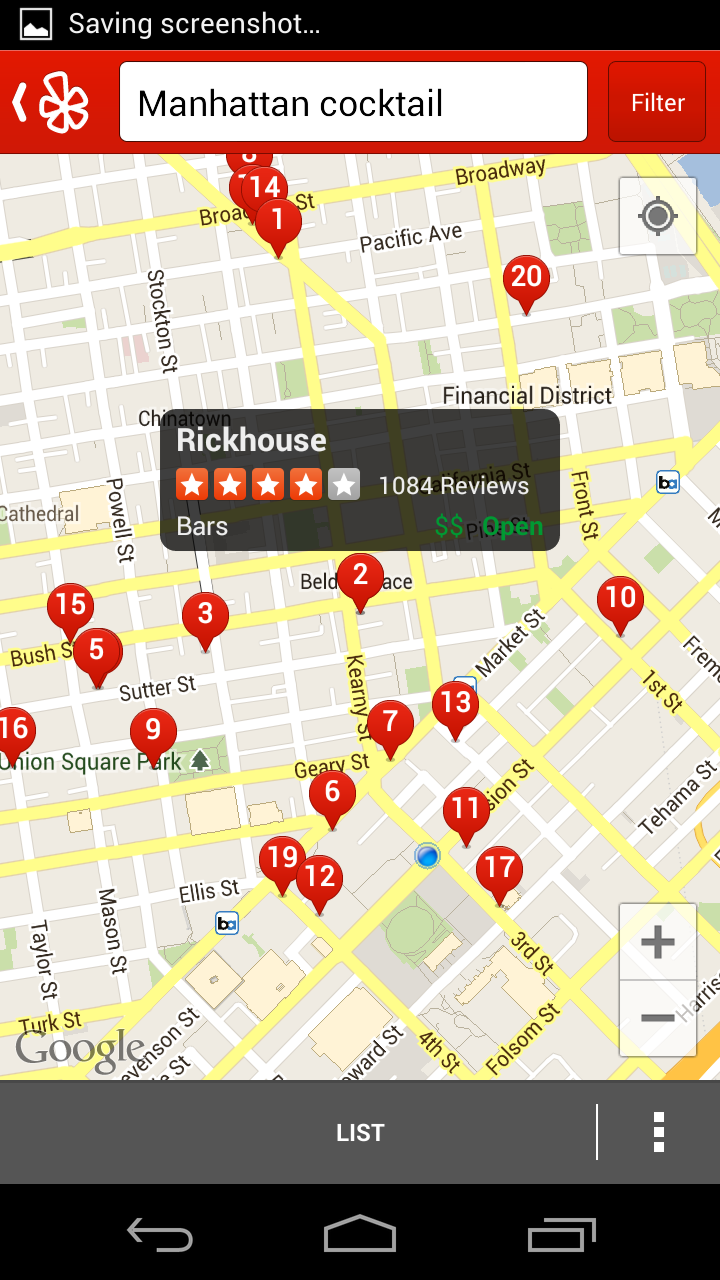
20.5 Investigation: Interactive

20.6 Explorable: Interactive
20.7 Another Case notes
- Another case for Interactivity is geographical data
20.8 New tools: Simple
20.9 New tools: Flexible
20.10 Unique notes
- You can see this is not a standard visualization
- It is one that is customized to its purpose
- Made possible by flexible tools
21 Dimensions
- Fun
- cool, pretty, engaging
- Actionable
- realtime, contextual, connecting
- Easy
- available for non-experts, remove repetition
- Interactive
- fast, explorable
- Flexible
- expressive, full access to lowest level
21.1 Consider Tradeoffs notes
- Visualization is just part of making an effective biz, team
- Interested in working at Yelp?