2013-02-08-Probability
Table of Contents
- 1 Probability
- 2 Nomenclature
- 3 Central Tendency
- 4 The Long Tail
- 5 Dispersion
- 6 Quartiles
- 7 Standard Deviation
- 8 Visualization Tools
- 9 Mathmatical Representation
- 10 Waterworld
- 11 Similarity | Distance
- 12 Nominal Distance
- 13 Binary Distance
- 14 Jaccard Coefficient
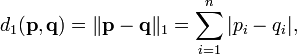
- 15 Euclidean distance
- 16 Manhattan distance
- 17 Lp norm
- 18 Ordinal Distance
- 19 Cosine Similarity
- 20 Cosine Example
1 Probability
2 Nomenclature
- Record
- a single entity or concept. Also: data object, sample, example, instance, data point
- Feature
- a characteristic or way of describing a record. Also: attribute, dimension, variable, signal
2.1 Slightly different from book notes
- The meanings do carry different connotations, but are generally transferable
- Eg. dimensions is usually used in the math domain
- Feature is usually used in the ML domain
2.2 Feautre Types
- Binary
- True/False. Also: 0/1
- Numeric
- Involving numbers. Also: integer, float, double
- Ordinal
- Feature with sortable values.
- Discrete
- countable, finite set. Also: classes
- Continuous
- unbounded numeric number. Also: integer, float, double
- Enumerated
- feature named, discrete values. Also: nominal, classed
2.2.1 Rain data set notes
- Stored did/dot not rain
- Stored how many inches it rained
- Stored the day as an integer offset from Jan 1 1970
- Stored weather information: Sunny, Partly Sunny, Cloudy, Rainy
- Stored barometer reading
- Stored day of the week
3 Central Tendency
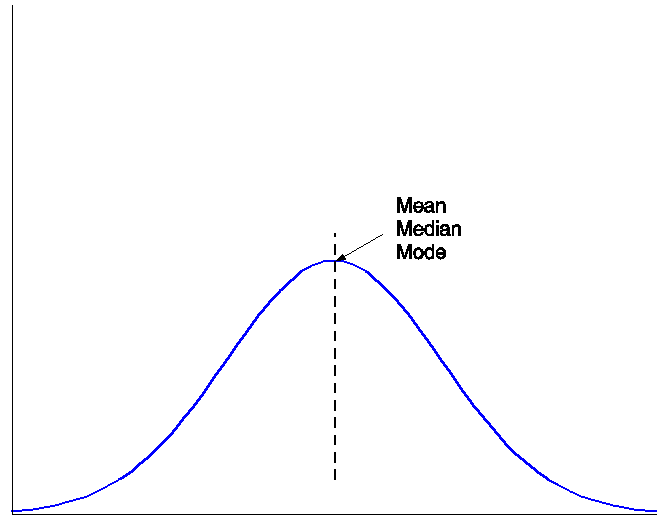
3.1 Define notes
- Mean
- "average" all data points divided by size of set
- Median
- middle value
- Mode
- The value most likely to be picked
- discrete
- most common value
- continuous
- max probability density function
3.2 Skew Positive
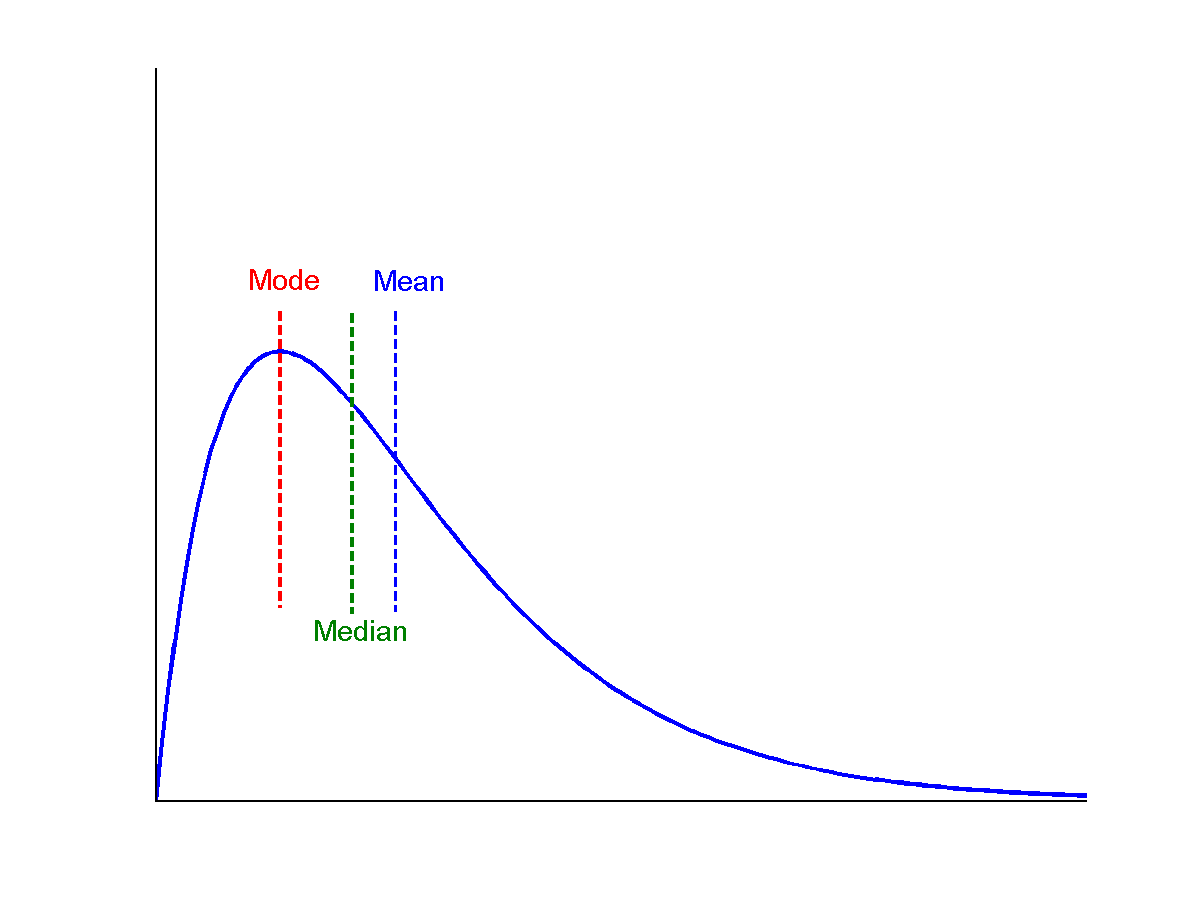
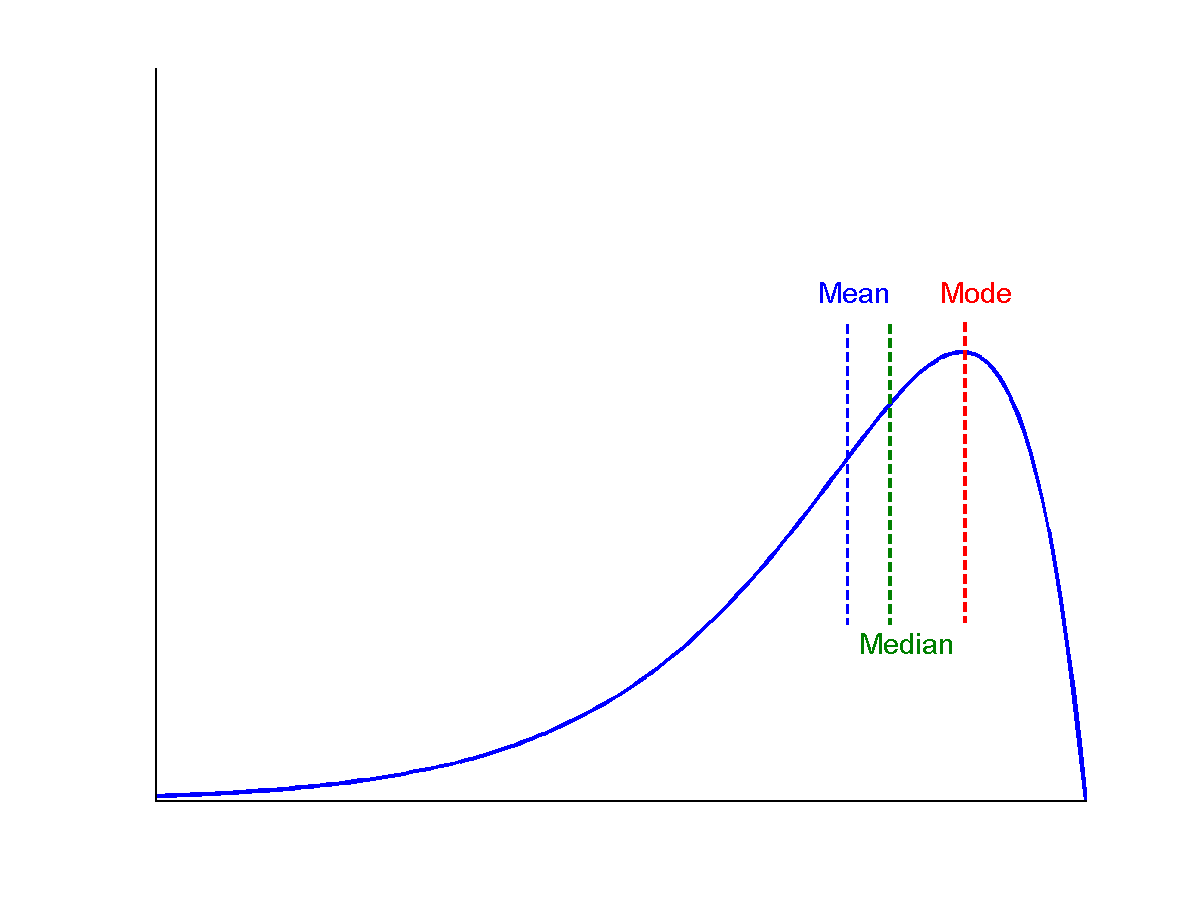
3.3 Skew notes
- Think about
mean - mode - Or think about where the "tail" is
3.4 Skew Negative
4 The Long Tail two_col
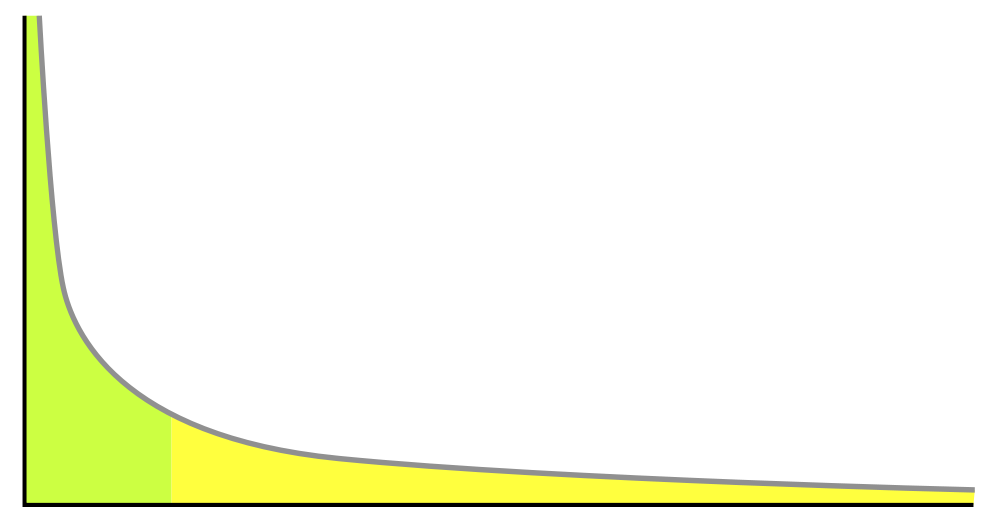
- Most popular are very popular
- Everything else, not so much
- But there's a lot of everything else
4.1 Movies notes
- Current releases: millions of people watching
- Older movies are rented by < 1 person a week
- What is the skew?
- Power law distribution (please follow up on Wikipedia or a stats class)
- Distributions are important, but will only be covered as necessary
5 Dispersion
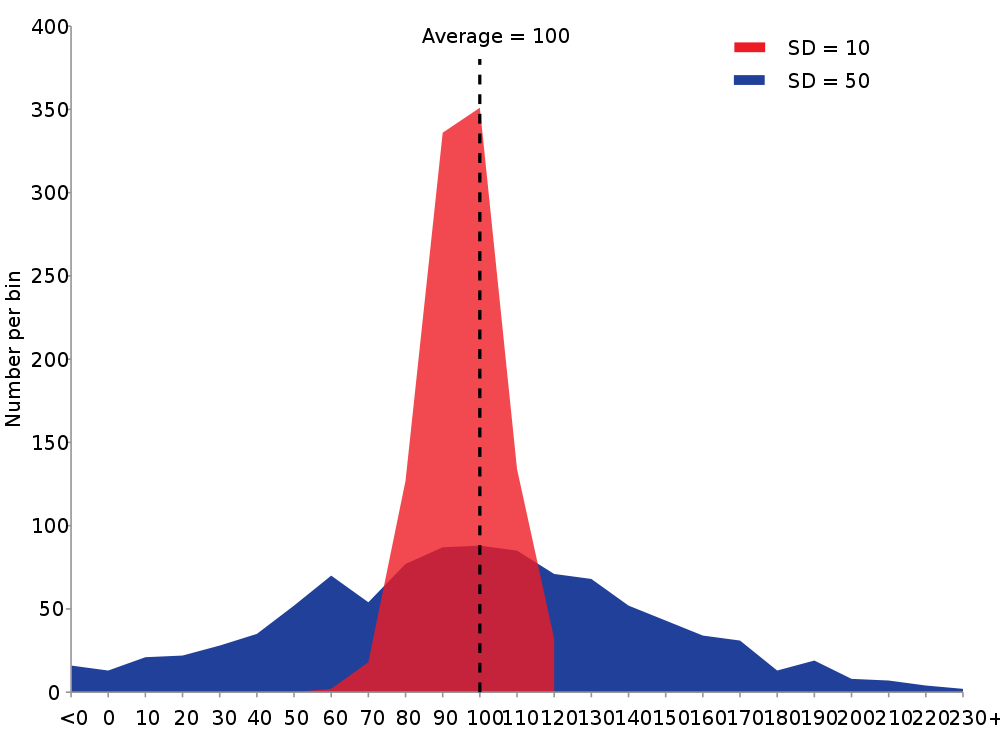
- Centrality not the whole story
5.1 Differences notes
- Wildly different data sets can still share many of these characteristics
6 Quartiles
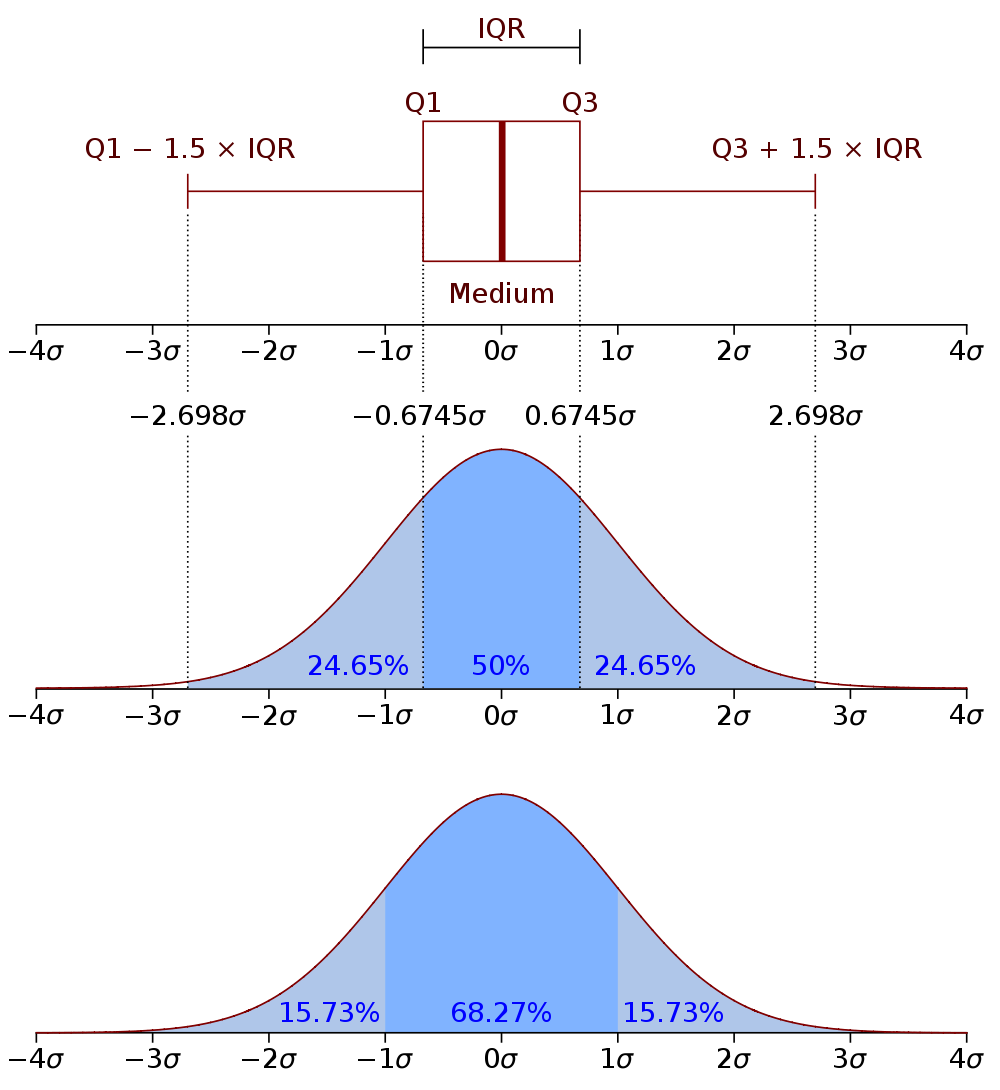
6.1 Parts notes
- Go back to our unskewed normal distribution
- Quartiles divide the data into quarters
- InterQuartile Range is the distance of the middle two quartiles
- BoxPlot is one of the most useful tools for data. For public results, I almost never want to see scatter plot or bar charts. I want to see box plots.
- Bottom, we spit it up into standard deviations
- Variance measures, on average, how far points are away from the mean
- Standard deviation is the square root of the variance
7 Standard Deviation
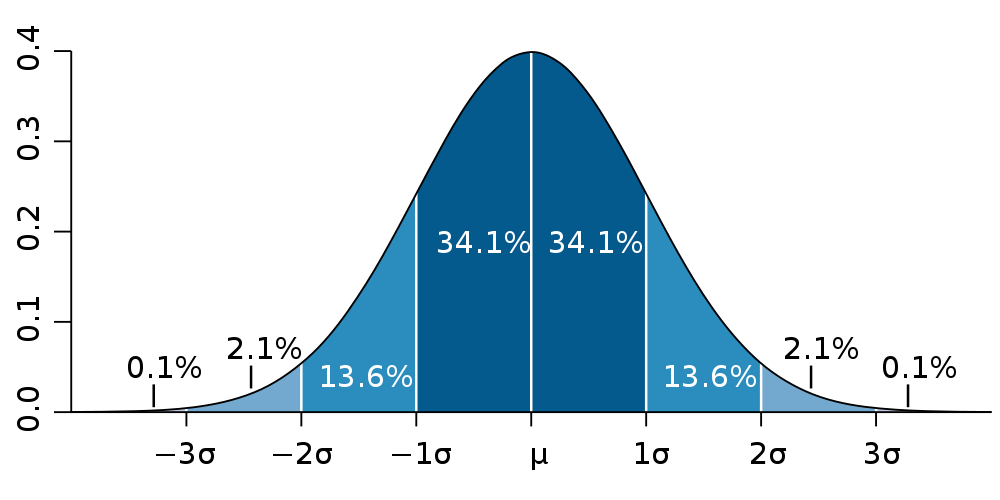
- Within 1: 68%
- Within 2: 95%
- Within 3: 99.7%
7.1 Standard Deviation notes
- Useful for thinking about what % of outliers you'd like to catch
- We use it for alerting: let us know when we're 2 stddev away from the median, there's a very small likelihood of that happening
8 Visualization Tools
- Python: Matplotlib
- R: builtin
- Matlab: builtin
- Octave: builtin (gnuplot)
- HTML: D3.js
8.1 Covered later notes
- Chapter 2 is going to cover some visualization stuff
- We're going to cover visualization a bit later in the course, and more of a "how its done in industry"
- There is another class on visualization in general
9 Mathmatical Representation
| Bad Boys | Robin Hood | Waterworld | |
| Prabha | 1 | 3 | 2 |
| AJ | 5 | 4 | 3 |
| Victor | 4 | 4 | 1 |
[ 1 3 2
  5 4 3
  4 4 1 ]
9.1 Matrix notes
- Matrix representations very powerful, as we'll see later in class
- Usually rows are records, columns are attributes
- Sometimes you can think of data in different ways, can take the transpose of the matrix to get attributes about movies
10 Waterworld

11 Similarity | Distance
- Two sides of the same coin
similarity = 1 - distance- We'll use these metrics for many other algorithms
11.1 Core Concept notes
- Many data mining techniques rely on finding a way to quantify similarity
- When you think about questions like "how similar are two users?" "is this text plagiarism?" "are these products likely to be purchased together?"
- All are ways of thinking about similarity
12 Nominal Distance
- Ratio of mismatches to potential matches
- Why can't we take the sum of the mismatches?
12.1 Nominal notes
- Nominal means we can't compare two values: there is no ordering
- All we can do is take ratio of the ones that are exactly the same
- The book describes how to think about this in terms of matrices
13 Binary Distance
- Could use Nominal Distance: count all exact matches or mismatches
- Could use Numeric Distance: just treat values as 0/1
- asymmetric binary dissimilarity: don't care about negative matches
mismatches / (positive_matches + mismatches)
- asymmetric binary similarity: care more about positive matches than mismatches
positive_matches / (positive_matches + mismatches)
13.1 Binary notes
- Nominal problem: for rare attributes, like a disease, two people who don't have the disease, aren't necessarily very similar
14 Jaccard Coefficient
- Asymmetric binary similarity
- More commonly used for calculating set similarity
|intersection| / |union|- "Jim likes pizza" | "Shreyas likes pizza"
14.1 Jaccard notes
- Break up into a set
- calculate # in intersection
- calculate # in union
- divide
15 Euclidean distance
- Straight line between two points
- Again: usually considered with just (x,y), but can calculate for any number of dimensions
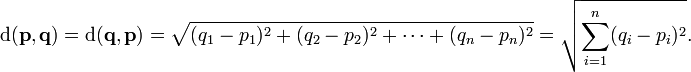
15.1 Ordinary notes
- Distance as you probably learned in grade school
16 Manhattan distance
- How many blocks would you need to walk between two points?
16.1 Usefulness notes
- Obviously useful for maps/directions
- But haven't seen it used much beyond that
17 Lp norm
- Euclidean distance and Manhattan can be generalized
- Euclidean distance referred to as L2 norm
- Chebyshev distance is L∞

17.1 Lp space notes
- Important for signal processing, math, other applications
- You may want to study these distances for comparing wave forms, like audio
18 Ordinal Distance
- Normalize the ordinal rankings
- Use a numerical distance metric
19 Cosine Similarity
- Jaccard similarity can work well for sets of roughly equal size
- How to compare sets with a large difference in magnitude?
- Model them as vectors, take the cosign of the angle between
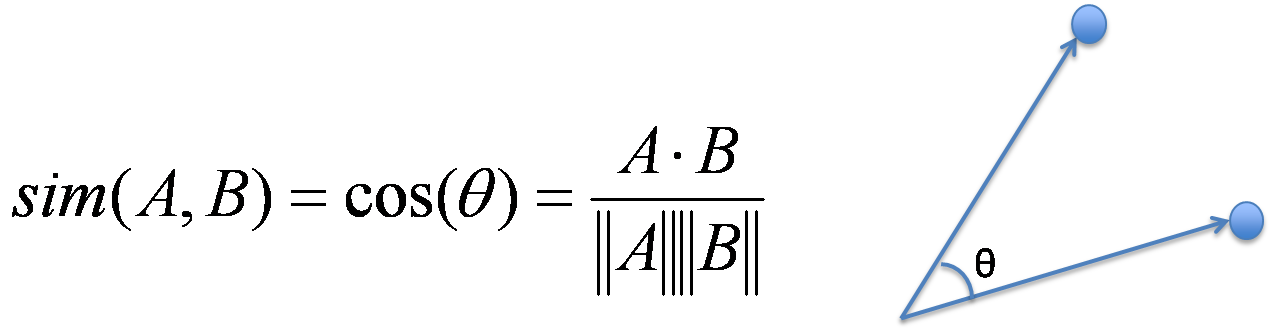
19.1 Cosign notes
- Why cosine? Hint: nomalization
- img: http://cs.carleton.edu/cs_comps/0910/netflixprize/final_results/knn/index.html
20 Cosine Example
- "Jim likes pizza" | "Shreyas likes pizza"